This report was also published by Seeking Alpha.
Introduction
During the third quarter of this year, the LNG shipping sector, represented by the UP World LNG Shipping Index (UPI), strengthened and gained 1.74%. In contrast, the S&P 500 (SPX) index lost 2.52% during the same period. You can see both indices on the chart below.
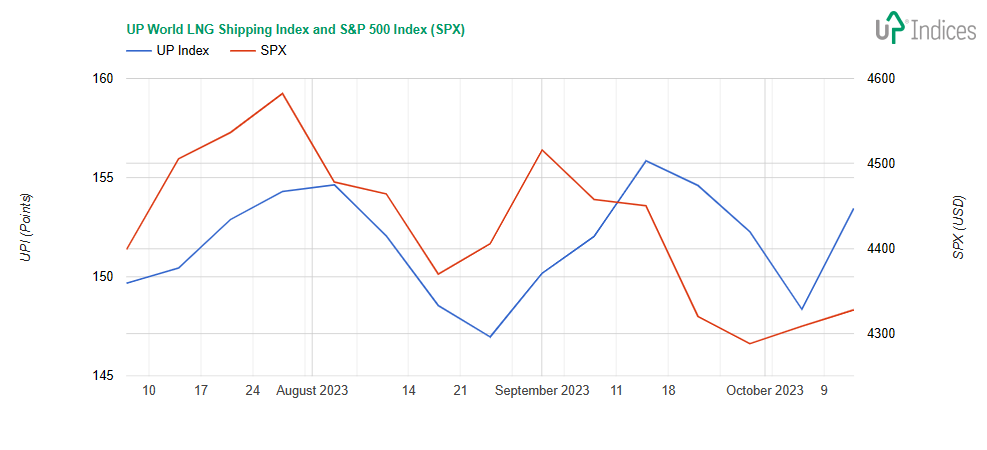
Weekly chart of the UP World LNG Shipping Index with S&P 500 (UP-Indices.com)
While UPI made a higher high and lower low, which is a technical pattern for an uptrend, SPX did just the opposite and started a downtrend. That is very important for future development, as we see at the end of this article.
In summer, preparations for the winter season begin with the delivery of increasing amounts of LNG. This often leads to higher spot rates for LNG carriers due to the reduced availability of ships. Many LNG shippers operate on long-term charters, but every vessel on the spot market improves the revenues.
Positive Alpha
Below is a chart displaying the difference in performance (Alpha) between the UPI and the SPX. Negative numbers indicate lower gains for UPI against SPX and vice versa. During the quarter, there were six weeks when SPX outperformed UPI but seven weeks when UPI outperformed SPX. Additionally, the gains of UPI were more significant.
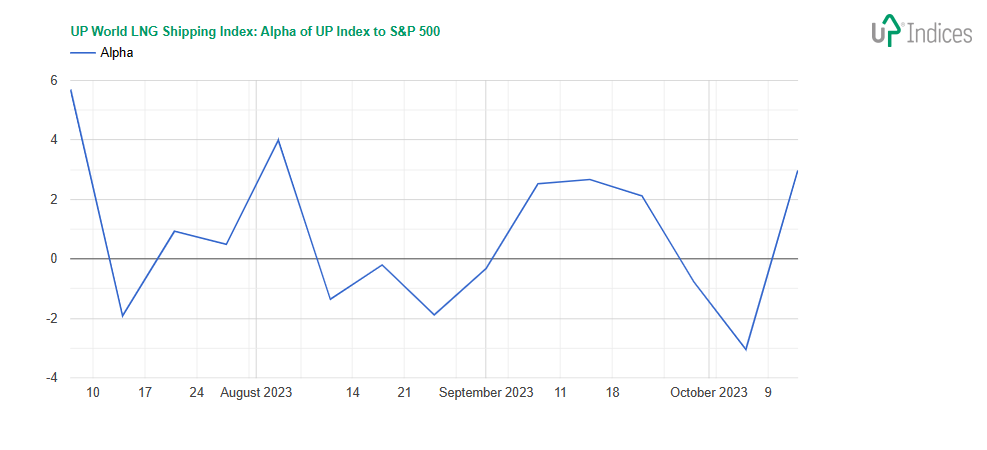
Performance of the UP World LNG Shipping Index to the S&P 500 (UP-Indices.com)
Stable Volatility
The chart below illustrates the volatility of the UPI in relation to the SPX. As observed, the UPI volatility is consistently lower than the SPX, staying below 1. Particularly this year, the UPI has been moving within a bracket without any significant trend.
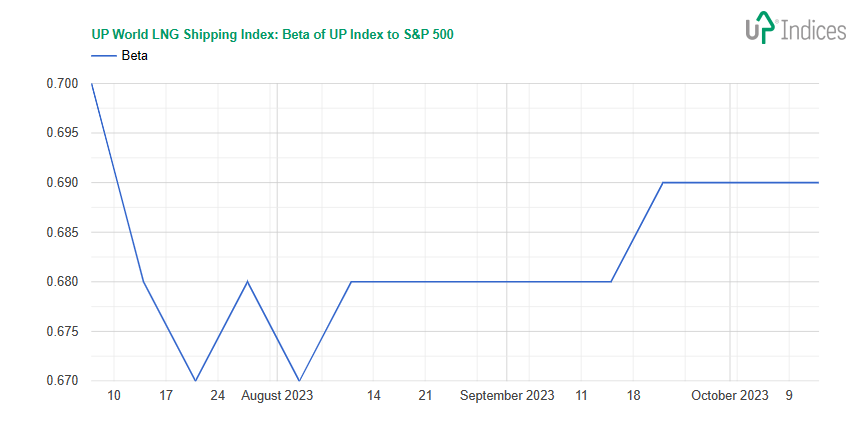
Chart of the volatility of the UP World LNG Shipping Index to the S&P 500 index (UP-Indices.com)
Constituents
UPI consists of eighteen global LNG shipping companies from the U.S.A., Europe, or Asia; all constituents are named with tickers in the table with their Q3 and Q2 gains or losses. The table is sorted from top Q3 gainers to down. In this report, I focus on the third quarter.
The second quarter’s performance helps to understand the long-term development of each constituent and also enables us to see the performance geographically. Let’s look at the numbers now.
Performance of LNG shippers in the third and second quarter of 2023
Name (Ticker) | Performance Q3 2023 | Performance Q2 2023 |
Kawasaki Kisen Kaisha, Ltd. (“K” line) (TSE: 9107), (OTCPK: KAKKF) | 31.65% | 13.52% |
New Fortess Energy Inc. (NFE) | 19.64% | -4.56% |
Nippon Yusen Kabushiki Kaisha (TSE: 9101), (OTCPK: NPNYY) | 15.93% | 0.72% |
Mitsui O.S.K. Lines, Ltd. (TSE: 9104), (OTCPK: MSLOY) | 11.75% | 2.70% |
BP p.l.c. (BP) | 9.84% | -10.68% |
Chevron Corporation (CVX) | 9.34% | -6.14% |
Golar LNG Limited (GLNG) | 8.79% | -3.72% |
Shell plc (SHEL) | 7.93% | -0.31% |
Dynagas LNG Partners LP (DLNG) | 6.27% | -7.38% |
Cool Company Ltd. (OSE: CLCO) (CLCO) | 4.21% | 16.80% |
UP World LNG Shipping Index | 1.74% | -3.79% |
Capital Product Partners L.P. (CPLP) | 1.60% | 6.72% |
MISC Berhad (KLSE: 3816), (OTC:MIHDF) | 1.29% | 0.00% |
Exmar NV (BSE: EXM), (OTCPK:EXMRF) | 1.09% | -8.08% |
Flex LNG Ltd. (FLNG) | -1.37% | -8.65% |
Awilco LNG ASA (OTCPK:AWLNF) | -1.67% | 14.71% |
Korea Line Corporation (SM Korea Line) (KRX: 005880) | -9.23% | 13.52% |
Nakilat (Qatar Gas Transport Company) (QSE: QGTS) | -10.43% | 9.92% |
Excelerate Energy, Inc. (EE) | -18.16% | -11.11% |
The table indicates that Japan’s stocks have been on the rise during the second and third quarters of this year, with the “K” line in particular experiencing the only double-digit returns. The company operates various ships, including LNG, container, dry bulk, tankers, and car carriers. In Q3-2023, the operating revenues increased to ¥236.7 billion, up from ¥222.2 billion in the second quarter. The following chart provides a comparison of this Japanese shipper with the UPI.
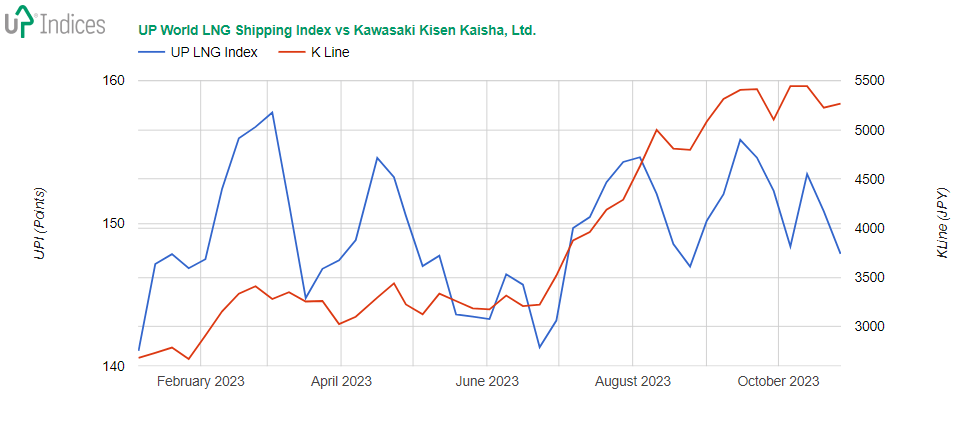
Chart of Excelerate Energy with UP World LNG Shipping Index (UP-Indices.com)
Excelerate Energy experienced a significant decline in the last few quarters, despite their successful deal to deliver LNG to Bangladesh and chartering their last free Floating Storage Regasification Unit (FSRU) Sequoia to Brazil’s Petrobras. Although they own the largest fleet of FSRUs, most of their revenue comes from selling LNG, mainly to Brazil. At the beginning of this year, the company’s stocks were considered overvalued. Now, the price has significantly decreased, but the downward trend continues. According to the SEC filing for the second quarter, revenues generated by FSRUs increased to $125,462 thousand from $110,072 thousand in Q2-2022, but gas sales declined to $306,910 thousand from $512,807 thousand in Q2-2022. The Q3 results are expected to be released on November 9. Below is the chart of Excelerate Energy with UPI.
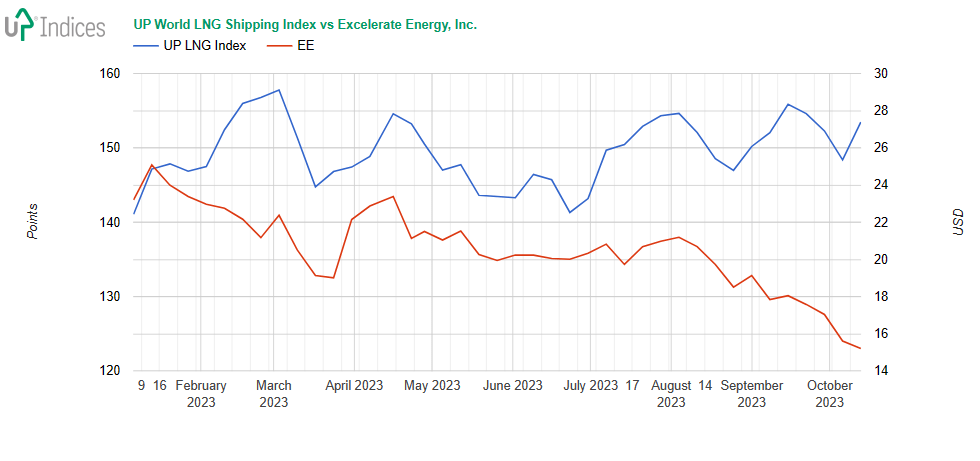
Excelerate Energy with the UP World LNG Shipping Index (UP-Indices.com)
Hidden Power of LNG
In the past quarterly report, I estimated the UPI would rise above 155 points. Well, this happened on September 15, when UPI closed at 155.85 points. But this was the highest point of the third quarter, and the uptrend was finally over at the end of October, as shown on the last chart. It is good to mention that there was a decline in the main U.S. markets that pushed UPI down. Still, UPI moves between support and resistance, trending to an up move. Even the magnitude of the whole SPX couldn’t push it down. This is the hidden power of the LNG shipping sector.
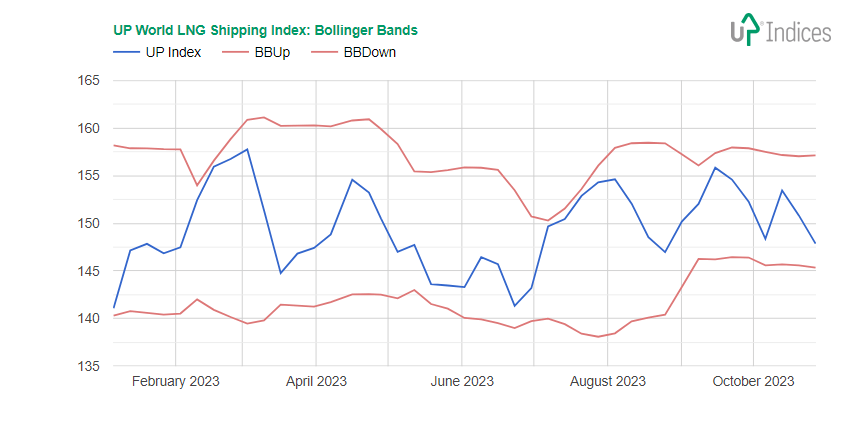
Chart of the UP World LNG Shipping Index with Bollinger Bands (UP-Indices.com)
Conclusion
What can we expect from the LNG shipping sector in the last quarter? Currently, the UPI is in a position where both the upper and lower bounds are strongly guarded. Sellers are keeping the top in check, while buyers are holding the bottom line. However, the winter heating season will likely help buyers push the UPI higher. Nevertheless, the declining stock markets have the potential to slow or even halt this progress, just like they did in the third quarter, and vice versa. The LNG sector has shown its maturity and competitiveness in the global energy market over the last year. I believe that in either the previous quarter of this year or the first of the next, the UP Index will achieve a new all-time high.
Source: UP-Indices.com via LNGshippingstocks.com
Would you like to get the UPI Weekly Report to your mailbox? Just register!