
Listen audio summary (Spotify)
Summary
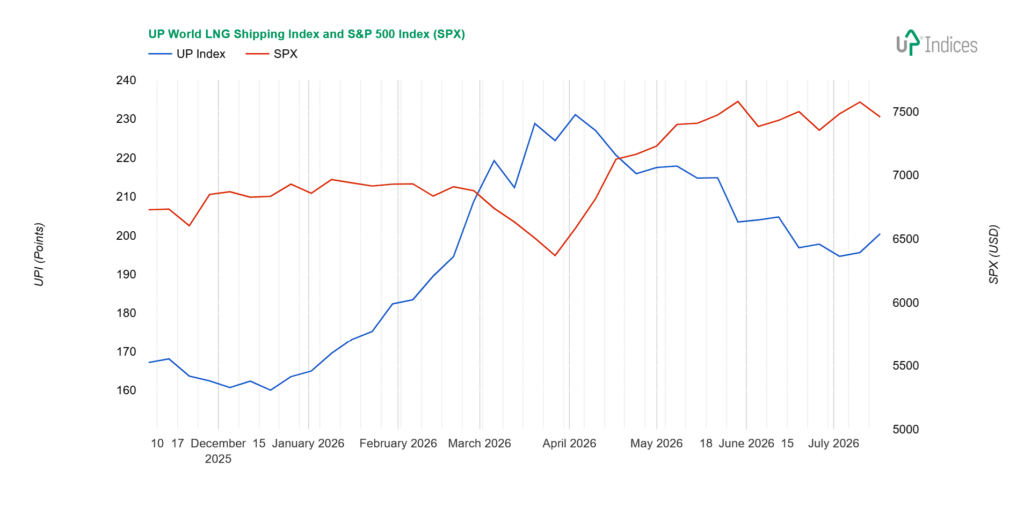
The UP World LNG Shipping Index gained 4.84 points (2.47%) last week, closing at 200.42 points and returning above the 200-point mark, while the S&P 500 lost 1.55% amid a semiconductor selloff. The weighted index rose by as much as 4%, though the ratio of advancing to declining stocks was even at 10:10 and trading volume was below average. A new factor — time — joins geopolitics and weather: summer demand is rising, and Europe must fill storage before winter. ICIS now forecasts a global LNG market decline of 9 million tonnes rather than the expected 30 million tonnes of growth, while Asian spot LNG has surpassed $20/mmBtu. NYK Line led the gainers with +8%, while COSCO Shipping Energy Transportation posted the largest decline for a third consecutive week.
UPI & SPX
The UP World LNG Shipping Index, which tracks 20 listed LNG shipping companies, gained 4.84 points (2.47%), closing at 200.42 points, while the S&P 500 index lost 1.55%. The chart below illustrates the performance of both indices with weekly data.
Broader View
The UPI is back above 200 points, and the weighted index (wUPI) rose by as much as four per cent.
The ratio of advancing to declining stocks was even at 10:10, and trading volume was below average.
We’ll add a third reason—time—to our two existing ones: geopolitics and weather. Summer is in full swing, and demand for natural gas is rising. This is due not only to the current weather but also to Europe’s need to fill its storage facilities before winter.
The situation in Europe is still not tense, but developments in the Middle East do not suggest a quick resolution. We therefore expect European restocking efforts to intensify. After all, the problematic availability of LNG following the collapse of Qatar’s long-term contracts is most acute for countries such as Pakistan, which had issued a call for bids for July delivery.
Moreover, a Reuters weekly summary cites an ICIS report forecasting a 9 million metric ton global decline in the LNG market, rather than the originally expected growth of 30 million metric tons. In contrast, the spot price of Asian LNG has surpassed $20 per mmBtu. For Europe, prices remain around $18.
“While European gas storage levels slowly increased from around 51.8% to 52.8%, market participants remained concerned that lower LNG imports and subdued injection rates could leave Europe short of its winter storage targets,” said Aly Blakeway, head of Atlantic LNG at S&P Global Energy.
Spot rates remain at $96,000 per day for the Atlantic and $74,000 per day for the Pacific, according to Spark Commodities.
Constituents
No company achieved double-digit growth. NYK Line (TSE: 9101; +8%) posted the strongest gain, as it attempts to resume growth from the base of the sideways range. Like many of the companies mentioned in the previous report, it managed to break through the baseline resistance this time as well, but not the key resistance level. The breakout is therefore not yet complete.
Similarly, “K” Line (TSE: 9107) posted a 7.8% gain. However, it faces fewer obstacles to resuming growth, as its sideways range was just below its all-time highs.
Three oil and gas producers ended the day with 6% gains: BP (NYSE: BP; +6.89%), Chevron (NYSE: CVX; +6.22%), and Shell (NYSE: SHEL; +6.19%). Shell and Chevron have returned to the range seen from late March through May—that is, after the initial shock of the war had subsided. BP still has a little way to go to reach that target.
The third member of the Japanese trio, Mitsui O.S.K. Lines (TSE: 9104), rose 5.35%. That was enough to return to a sideways trading range.
FLEX LNG (NYSE: FLNG) gained 2.2% and, like many others, continues to trade sideways. An attempt at a larger rally was rejected during the week.
MISC (KLSE: 3816) rose by 0.8%, but a move for further gains was rejected, and the price thus reached only the lower edge of the range and remained below it.
COSCO Shipping Energy Transportation (SS: 600026) saw the biggest decline, losing nearly 10 %, marking its third consecutive drop. Support may be found at 13 renminbi, the upper boundary of the nearest range.
Dynagas LNG Partners (NYSE: DLNG) fell 8.42%, keeping the price below its previous medium-term range.
Tsakos Energy Navigation (NYSE: TEN) lost 5.14%, but the move was merely sideways. The same can be said for Golar LNG (NASDAQ: GLNG), which fell by 3%.
Korea Line Corporation (KRX: 005880) appears to be forming a new sideways range. On the other hand, this marked the second consecutive rejection of an uptrend, with a return to the previous opening price after a 3.78% decline.
At the upper range, ALNG (OSE: ALNG) is holding steady despite a 2.47% decline, as the market awaits the results of an extraordinary general meeting scheduled for early August.
Crystal Ball
Qatar has been temporarily sidelined among the conflict’s losers due to industrial damage to its facilities, whilst US LNG exporters—and European importers—emerge as the clear winners. However, the vulnerable Panama Canal and ongoing US-Chinese tensions warrant attention. We expect most of the rising US gas production will flow towards Europe. New global LNG producers should also benefit from this conflict, as energy source diversification becomes more important than ever—provided importing economies remain healthy enough to absorb higher energy costs.
The outlook remains volatile, but positive in the long term. Companies with spot tankers are benefiting from high rates and longer distances. The gradual phasing out of steamers and the addition of new liquefaction capacity will continue to drive the sector forward.
About UPI
Established in 2020, the UP World LNG Shipping Index is a rules-based family of stock indices designed to measure the performance of publicly traded companies worldwide engaged in the maritime transportation of liquefied natural gas (LNG). This unique index comprises 20 companies and partnerships worldwide, representing more than 65% of the global LNG carrier fleet in 2020. The UP Index provides premium services, offering freemium and trial access to charts. With the Freemium plan, users can access the basic UP Index vs S&P 500 chart after completing email registration. The trial includes full access for fourteen days.
Final Note
This report primarily relies on technical analysis using weekly data. The summary section is AI-generated.
Disclosure: The author holds beneficial long positions in the shares of ALNG, EE, FLNG, and NFE, whether through share ownership, options, or other derivatives. This report was prepared in-house and reflects our own opinions. We have received no compensation for it and have no business relationship with any company whose shares are mentioned herein.
Disclaimer: This report is provided for informational purposes only and does not constitute investment advice, nor a recommendation or solicitation to buy or sell any securities. It relies primarily on technical analysis using weekly data. Readers should conduct their own research and consult a qualified financial adviser before making any investment decisions.