Summary
The UP World LNG Shipping Index lost 4.10 points (1.78%) last week, closing at 226.94 points, while the S&P 500 gained 3.56% — driven by optimism over a potential ceasefire with Iran. The UPI’s decline reflects three converging factors: easing geopolitical tensions, the end of the winter season, and falling spot tanker rates. Atlantic rates stood at $89,750/day and Pacific rates at $73,000/day according to Spark Commodities. The ratio of gainers to decliners was 7:13, and trading volume was at average levels — though even that remains double the historical norm following the recent surge.
Qatar’s gas infrastructure remains damaged and offline. According to Alex Froley of ICIS, 15 loaded LNG tankers are waiting in the Persian Gulf, ready to sail as soon as conditions allow. In comparison, Iran’s Revolutionary Guards turned back two tankers that attempted to pass through last week. Weekly exports from U.S. terminals reached 37 tankers — above the historical average of around 30. Korea Line Corporation led the gainers with a remarkable +29.3%, followed by New Fortress Energy (+23.16%) — more a return to high volatility than a trend reversal — and Nakilat (+9%), which moved back into its support zone. On the downside, Chevron fell 5.24%, while Mitsui O.S.K. Lines, Capital Clean Energy Carriers, and Flex LNG each declined around 4%. Looking ahead, the Q2 shortfall in LNG supplies will need to be addressed. The return to coal is viewed as temporary; longer shipping routes and geographic diversification of supply are structural tailwinds for the sector.
UPI & SPX
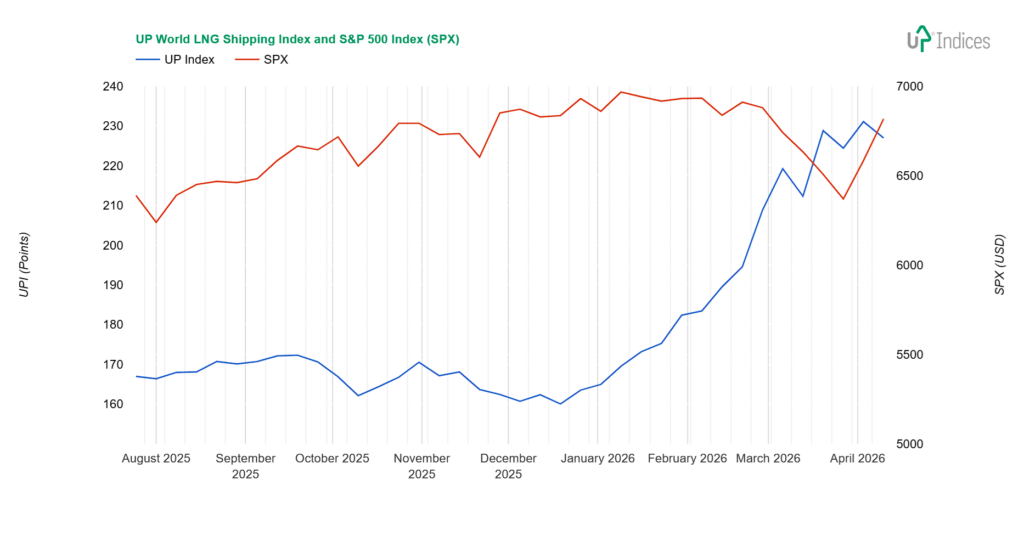
The UP World LNG Shipping Index, which tracks 20 listed LNG shipping companies, lost 4.10 points (1.78%), closing at 226.94 points, while the S&P 500 index gained 3.56%. The chart below illustrates the performance of both indices with weekly data.
Broader View
The easing of geopolitical tensions led to a decline in the UPI.
The UPI fell from record highs, and this sharper decline is altering the index’s trajectory. A slowdown is occurring, reflecting 1. the calming of the geopolitical situation, although a resolution is still far off; 2. the end of the winter season; and 3. the decline in spot rates for LNG tankers.
The calming of the situation in the Middle East does not mean the problems have been resolved, as Qatar’s gas infrastructure has not only halted production but has also been damaged by bombing.
According to Reuters, 15 LNG tankers are loaded in the Gulf and ready to set sail as soon as it is safe to do so. Two tankers that attempted to pass through last week turned back after being stopped by Iran’s Revolutionary Guards. According to Alex Froley, Qatar typically dispatches 90–100 tankers per month, while, as reported by LNGPrime, weekly exports from U.S. terminals reached 37 tankers, two fewer than the previous week. These figures indicate growing U.S. exports, with the historical average around 30 tankers per week.
Spot rates continue to decline, with the Atlantic route costing $89,750 per day and the Pacific route $73,000 per day, according to Spark Commodities|.
Back to the UPI, which is showing signs of exhaustion. Trading volume was average, though even that has doubled from its usual level after the recent surge. The ratio of rising to falling stocks was 7:13.
Constituents
Although the UPI fell, we’ll start with the rising stocks. There are several interesting ones right off the bat.
First is the nearly 9% rise in Nakilat (QSE: QGTS). The second LNG carrier from the war zone is also rising, albeit later than ADNOC L&S. With average trading volume, Nakilat has moved back into the support zone we’ve seen since the end of last year.
The second point of interest is the 29.3% rise posted by Korea Line Corporation (KRX: 005880). After several weeks of hesitation, KLC has decided to rise and has nearly reached the short-term (unsustainable) peak from the start of the attacks on Iran. Trading volume in this case is above average, but not extreme.
New Fortress Energy (NASDAQ: NFE) also posted strong double-digit growth, rising by 23.16%. This is more of a return to high volatility than a reversal of the negative trend. We have discussed the reasons for the current decline in previous reports. Recall that this is a reaction to the restructuring, which diluted existing equity stakes.
Excelerate Energy (NYSE: EE) is still trading near its support level despite a 5% gain. ADNOC Logistics & Services (ADX: ADNOCLS) rose by 2.69%, reaching older price levels, but it currently remains below the more recent ones. The rally is thus relatively fragile.
MISC (KLSE: 3816) chart looks very similar to that of the aforementioned Excelerate Energy. MISC is trading in the support zone, with growth above 8.51 ringgit having been suppressed for the fourth week in a row. Last week, the stock rose by one per cent within the support zone.
Declines, though more numerous, were not as pronounced. Chevron (NYSE: CVX) saw the largest loss, at 5.24%. This marks the second consecutive decline, though it may simply be a correction. The main reasons are geopolitical events and oil price developments.
Most declines hovered around three to four percent: Mitsui O.S.K. Lines (TSE: 9104, -4.33%), Capital Clean Energy Carriers (NYSE: CCEC, -4%), FLEX LNG (NYSE: FLNG, -4%), Golar LNG (NASDAQ: GLNG, -3.64%), COSCO Shipping Energy Transportation (SS: 600026, -2.98%), and Tsakos Energy Navigation (NYSE: TEN, -2.94%).
With this decline, Mitsui’s growth prospects have diminished, as the chart’s current pattern is indecisive and a sideways trend is at risk. CCEC continues to decline, and the price has reached the support level from 2024–25. During the week, it fell below that level but has since rebounded.
FLEX LNG remains below the $30.50 resistance level and is forming a sideways trend. The future direction is difficult to predict. The decline in spot rates has eroded clear growth drivers, while new long-term contracts have strengthened the company’s future cash flow. The upcoming quarterly commentary will be important, as will developments in spot rates and the overall geopolitical situation. In this regard, FLNG is not alone.
Golar failed to capitalise on the positive sentiment from the week before last, and the share price weakened. This does not clearly signal a change in the upward trend, especially given that trading volume was below average.
COSCO is also moving sideways, although the price continues to creep higher within the sideways range; it has not yet managed to hold above 26 yuan.
Tsakos also paused its upward trend; during the week, both upward and downward momentum were tested. However, neither has yet gained enough traction to determine the direction of the next move.
Crystal Ball
The second quarter is usually the weakest period of the year. However, geopolitical circumstances and the associated loss of nearly 20 per cent of global LNG production mean that this year will be different.
Europe still has an advantage over Asia; refilling storage facilities can still wait, and greater purchasing power may once again redirect gas from Asia to Europe. Europe, however, needs it now, and the increased—albeit currently falling—prices will be paid by the poorest countries, such as Bangladesh, which is seeking additional spot supplies.
Russia is seeking to capitalise on the opportunity, taking advantage of the U.S. administration‘s current inclination towards its worldview. However, as soon as this reduces U.S. LNG supplies to Asia, the game will be over. Europe is also increasing its imports of Russian LNG, as the U.S.’s sometimes hostile stance is fuelling fears of dependency. Unlike Russia, however, the U.S. remains a democracy.
As we noted last year, it has been worthwhile to monitor the contracts of LNG shipping companies—specifically, which regions they serve. Those operating between the US and Europe, or between Australia and Asia, are more stable.
So what do we expect? The shortfall in LNG supplies will need to be replaced. We view the return to coal as temporary; we expect a gradual increase in spot supplies or, to a lesser extent, long-term contracts with newly commissioned terminals. Increased geographic diversification of suppliers, driven by greater energy security requirements, will lead to longer shipping routes and a greater need for tankers.
The long-term outlook remains positive. The scrapping of steam vessels and the addition of new liquefaction capacity are pushing the sector higher.
About UPI
Established in 2020, the UP World LNG Shipping Index is a rules-based family of stock indices designed to measure the performance of publicly traded companies worldwide engaged in the maritime transportation of liquefied natural gas (LNG). This unique index comprises 20 companies and partnerships worldwide, representing more than 65% of the global LNG carrier fleet in 2020. The UP Index provides premium services, offering freemium and trial access to charts. With the Freemium plan, users can access the basic UPI vs S&P 500 chart after completing email registration. The trial includes full access for fourteen days.
Final Note
This report primarily relies on technical analysis using weekly data. The summary section is AI-generated.