
Summary
The UP World LNG Shipping Index fell 9.35 points (4.07%) to close at 220.05, caught in a broad risk-off week — the S&P 500 had its worst week since the April 2025 crash, down 2.68%. The decline was near-universal: breadth was just 3:18, the median fell 6%, and the weighted index (wUPI) dropped 5.5%. Two forces combined after the US mid-term elections — a weakening administration that eased geopolitical risk premiums (and so energy prices), and a tech/AI-led equity selloff that dragged shipping down in tandem. European gas prices fell 17% on higher Qatari loadings and softer Asian demand. Only three names rose: Nakilat led (+10.12%, a third straight gain on US contracts and reduced geopolitical threat) and Excelerate added 4.1% after strong quarterly results (new Bahamas contract, extended Petrobras charter to 2038, updated Colombia/Iraq start dates). The fallers were led by Tsakos (−16.7%) and BP (−11.6%), with Chevron −9.73%, the Japanese trio down 7–9.5%, and Shell, NFE, FLEX LNG and Pan Ocean each off around 8%. Dynagas (−6.9%) was pressured by European sanctions concerns and a need for a new insurer. Spot tanker rates diverged sharply — Atlantic surged to $55,250, Pacific $32,750 — reflecting Europe’s new pull.
UPI & SPX
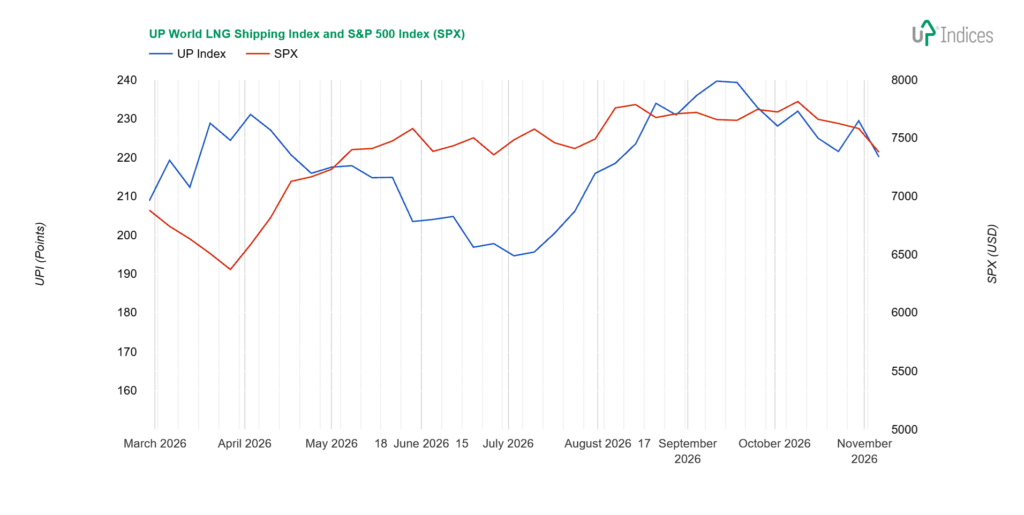
The UP World LNG Shipping Index, which tracks 21 listed LNG shipping companies, lost 9.35 points (4.07%) to close at 220.05 points, while the S&P 500 index lost 2.68%. The chart below illustrates the performance of both indices with weekly data.
Broader View
The fall in the UPI was quite significant, and two key related factors played a part: 1. the US mid-term elections and 2. developments on the stock markets. One might conclude that the first factor alone is the key driver, but it is more accurate to break this down into two factors. The weakening of the current US administration has reduced concerns about geopolitical consequences and, consequently, lowered energy commodity prices, while also dampening expectations and optimism around AI and its infrastructure. Shares linked to technology and various forms of shipping fell in tandem.
The UPI thus fell four per cent, with a median movement of -6 per cent and the weighted index (wUPI) down 5.5 per cent. Trading volume rose as expected, but not significantly. The ratio of rising to falling constituents was 3:18.
As Reuters reported in its weekly round-up, gas prices fell, particularly in Europe, where they fell 17 per cent.
Lower Asian demand and increased LNG flows through the Strait of Hormuz have made Europe a more attractive destination for cargoes, increasing supply offers there, said Martin Senior, head of LNG pricing at Argus.
“Prices have fallen over the past week, partly because of an apparent shift in tone towards de-escalation from Trump and increased expectations of Qatari supply, with loadings well above half of capacity,” Senior said.
European storage remains a key source of support, with inventories currently 74 per cent full – well below the seasonal average – leaving a smaller buffer heading into winter, said Aly Blakeway, head of Atlantic LNG at S&P Global Energy.
Regional appetite for LNG will be partly capped by China’s stable coastal LNG inventories, secured Bangladeshi supplies, and limited Pakistani spot demand. However, geopolitics will be the main price mover, particularly following the U.S. mid-term elections, with both increased attacks and de-escalation on the table, said Ronald Pinto, principal LNG and gas analyst at Kpler.
Spot charter rates for LNG tankers have increased. Reflecting Europe’s greater attractiveness, the Atlantic is $55,250 per day, and the Pacific is $32,750 per day, according to Spark Commodities.
Constituents
Only three companies grew, and one posted double-digit growth. Nakilat (QSE: QGTS) led the gains, rising for the third week in a row by 10.12%. It thus returned to the low level of the spring months and the high level of the summer months. After the American contracts and the reduction of the geopolitical threat (not the tension), cautious optimism prevails.
The second-largest growth was 4.1% and belongs to Excelerate Energy (NYSE: EE), which broke through the sideways trend after its quarterly results. The results brought information about a new Bahamian contract (from Q1 2027 via Jamaican infrastructure and from mid-2028 a new FSU directly in the Bahamas). Updated the start dates of FSRU contracts for Colombia (Q1 2027) and Iraq (Q2 2027). The contract with Petrobras (FSRU Sequoia) was also extended until 2038. LNG trading is playing an increasingly important role.
Both companies’ volumes were significantly above average.
The last positive result was the symbolic growth of Korea Line Corporation (KRX: 005880), at 0.21%. The price tried to rise during the week but fell back, so the last two weekly results are the same, creating temporary additional support within a broader sideways trend.
The biggest loser was Tsakos Energy Navigation (NYSE: TEN), which fell 16.7%. The decline pushed it below the current sideways movement, but it stopped at the spring peak’s closing price and slightly corrected the drop.
The second double-digit decline of the week was bp (NYSE: BP), which fell 11.6%. It thus fell from its peak back to the summer sideways-growth zone.
Two Japanese companies fell by 9 per cent: “K” Line (TSE: 9107; -9.5%) and Mitsui O.S.K. Lines (TSE: 9104; -8.1%) both fell from their peak prices to the bottom of their side band, with “K” Line even closing below it. A third Japanese company, NYK Line (TSE: 9101), also fell to support, losing 6.8%. The Japanese market decline affected all three more than other factors.
Chevron (NYSE: CVX) also fell 9%, or 9.73% to be precise. It also stopped at the spring price level after erasing three weeks of growth, and so far it has returned to the range it left three weeks ago.
Four companies have lost 8%, and that is the only thing that unites them.
Shell (NYSE: SHEL) fell more than 8.6%, but it remains the best performer among the oil and gas trio. It is still above spring prices, and the edge of the September-October mini-band stopped the decline.
New Fortress Energy (NASDAQ: NFE) corrected its growth from the week before last by a decrease of 8.74%, but as a result, its candle is positive thanks to the long shadow and small body in the upper part – lower prices were rejected this time.
FLEX LNG (NYSE: FLNG) fell 8.14% and traded in the $ 27- $ 24.5 range.
The last 8% decline belongs to Korean Pan Ocean (KRX: 028670), and the price is on the border of two consecutive price levels.
Golar LNG (NASDAQ: GLNG) fell to the lower level of the spring correction, losing 6.9%. This correction was followed by a 20% growth in the spring, which is unlikely now. Rather, a return to spring 2025 prices with a lower limit of $40.
Dynagas LNG Partners (NYSE: DLNG) is dominated by concerns about the impact of European sanctions on Russian gas. The partnership reported needing a new insurance provider. The price returned to the 2024 level after a 6% drop.
COSCO Shipping Energy Transportation (SS: 600026) lost 5.4%. Capital Clean Energy Carriers (NASDAQ: CCEC), which is also sideways, fell by five per cent.
The remaining companies that lost less than 2% by telegraph: ALNG (OSE: ALNG) held on to the upper limit of the sideband despite a 1.8% drop. MISC (KLSE: 3816) started the week with growth, but ended with a 1.7% loss. Exmar (EBR: EXM) continues to move sideways, losing 1.3% during the week. ADNOC Logistics & Services (ADX: ADNOCLS) fell 0.73%.
Crystal Ball
Qatar remains on the sidelines among the losers of this conflict, yet its actions over the past few days have boosted market optimism. Its efforts to honour its commitments and fulfil its orders are undoubtedly a significant boost to its customers. US producers are seeking to capitalise on the resulting vacuum by accelerating capacity expansion as supplier diversification takes place. Price is no longer the sole criterion, and even Bangladesh has announced that it has signed a long-term contract with a US producer.
Whilst the coming winter months will bring increased uncertainty and a scramble for gas – partly due to the uncertain geopolitical situation, with a significant risk of further US strikes on Iran – we expect the situation to stabilise and adapt in the spring, primarily through the diversification of suppliers.
About UPI
Established in 2020, the UP World LNG Shipping Index is a rules-based family of stock indices designed to measure the performance of publicly traded companies worldwide engaged in the maritime transportation of liquefied natural gas (LNG). This unique index comprises 21 companies and partnerships worldwide, representing more than 65% of the global LNG carrier fleet in 2020. The UP Index provides premium services, offering freemium and trial access to charts. With the Freemium plan, users can access the basic UP Index vs S&P 500 chart after completing email registration. The trial includes full access for fourteen days.
Final Note
This report primarily relies on technical analysis using weekly data. The summary section is AI-generated.
Disclosure: The author holds beneficial long positions in the shares of ALNG, EXM, FLNG, and NFE, whether through share ownership, options, or other derivatives. This report was prepared in-house and reflects our own opinions. We have received no compensation for it and have no business relationship with any company whose shares are mentioned herein.
Disclaimer: This report is provided for informational purposes only and does not constitute investment advice, nor a recommendation or solicitation to buy or sell any securities. It relies primarily on technical analysis using weekly data. Readers should conduct their own research and consult a qualified financial adviser before making any investment decisions.