
Audio summary (Spotify)
Summary
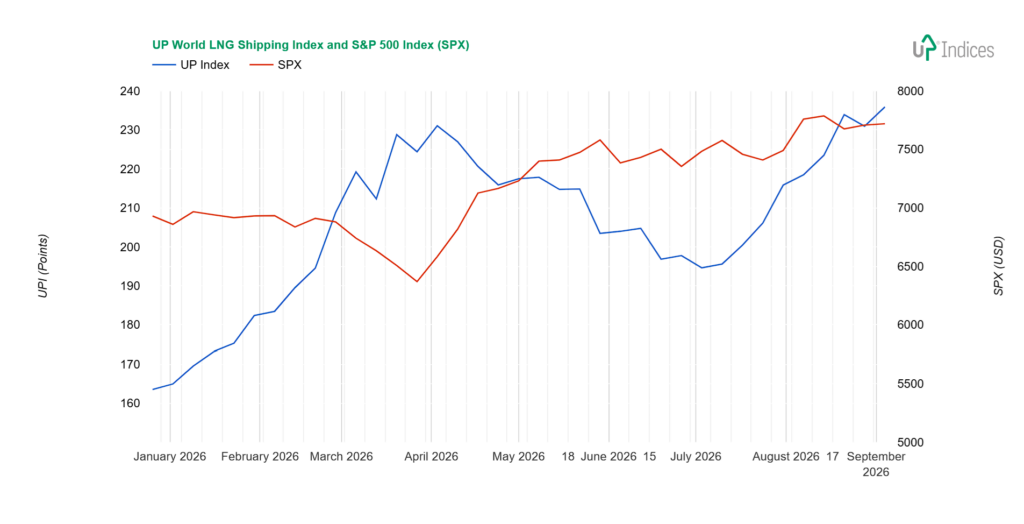
The UP World LNG Shipping Index gained 4.97 points (2.15%) last week, closing at a new all-time high of 235.88 points, while the S&P 500 gained 0.15%. Following a week’s break, the UPI returned to record territory. However, breadth was narrow — the ratio of advancing to declining constituents was 13:8, the median change was just 0.98%, and the weighted index rose only 0.14%. Trading volume increased in line with the breakout to new highs. Three factors continue to drive the market: the closure of the Strait of Hormuz, coupled with disrupted Qatari production; the weather; and the approaching winter season. Asian spot LNG prices reached a 3.5-year high, with Bangladesh paying $28/mmBtu for immediate delivery, while Atlantic tanker rates rose for the first time in seven weeks. COSCO Shipping Energy Transportation led the gainers with +8.1%, while New Fortress Energy fell the most at -6.5%.
UPI & SPX
The UP World LNG Shipping Index, which tracks 21 listed LNG shipping companies, gained 4.97 points (2.15%), closing at 235.88 points, while the S&P 500 index gained 0.15%. The chart below illustrates the performance of both indices with weekly data.
Broader View
Following a week’s break, UPI has once again risen to new highs. Three factors continue to drive the market: the closure of the Strait of Hormuz, coupled with the disruption to Qatari production; the weather; and the approaching winter season.
The ratio of rising to falling index constituents was 13:8. The median price movement was just 0.98 per cent. However, trading volume has risen again following the correction, in line with the index breaking through to new highs. However, the weighted index (wUPI) rose by just 0.14 per cent.
Spot LNG prices in Asia have risen to a 3.5-year high, Reuters reported in its weekly round-up.
In its report, it quoted Martin Senior of Argus, who said spot purchases in Bangladesh for immediate delivery were $28 per MMBtu, while prices for Asia with later delivery rose to $25.7 per MMBtu, with Asian demand, partly driven by India, on the rise.
“The inter-basin arbitrage has closed, which has supported offers into Europe, but falling charter rates have left some firms with excess shipping capacity with no other way to capitalise on it than by offering into Asia on a sunk-cost basis, thereby supporting cross-basin offers,” added Martin Senior.
We also quote further from the Reuters report:
In Europe, S&P Global Energy assessed its daily Northwest Europe (NWE) LNG price benchmark for cargoes delivered in October on an ex-ship basis (DES) at $23.695/mmBtu on Thursday, a $0.64/mmBtu discount to the price at the Dutch TTF gas hub.
Argus Media assessed the October DES NWE price at $23.725/mmBtu, whilst Spark Commodities assessed it at $23.884/mmBtu.
“NWE LNG prices continued to strengthen over the week, supported by renewed geopolitical tensions in the Middle East and persistent concerns over the adequacy of European winter supplies,” said Aly Blakeway, head of Atlantic LNG at S&P Global Energy.
“Whilst there has been an increase in available US volumes and more cargo offers for October and November delivery, particularly to
North-West Europe, uncertainty urrounding winter supply balances, storage requirements and the potential for further escalation in the Middle East limited trading activity,” he added.
In LNG freight, Atlantic rates rose week-on-week for the first time in seven weeks to $15,500/day, whilst Pacific rates eased to $22,500/day, said Spark Commodities analyst Qasim Afghan for Reuters.
Constituents
Despite the UPI rising to new highs, a look at individual companies paints a slightly different picture, as a clear and unhindered upward trend is rare. Many are also trading sideways, albeit near the upper limits.
However, COSCO Shipping Energy Transportation (SS: 600026) recorded the biggest gain. Its 8.1 per cent rise is part of an uptrend, but it is not unhindered, and it will take time to reach the upper resistance level. This is still a recovery following the summer correction from peak prices.
Six companies saw gains, starting with the number three. BP (NYSE: BP) rose by 3.9 per cent, Excelerate Energy (NYSE: EE) rose by 3.8 per cent, Golar LNG (NASDAQ: GLNG) added 3.6 per cent, Exmar (EBR: EXM) rose by 3.59 per cent, Chevron (NYSE: CVX) rose by 3.3 per cent and, finally, PAN Ocean (KRX: 028670) rose by exactly 3 per cent. Tsakos Energy Navigation (NYSE: TEN) remained just below this threshold, rising by 2.9 per cent.
BP is precisely the sort of company that is trading sideways. It managed to reverse the pre-holiday decline but remained in a range below its recent highs. Golar and Exmar are also trading within a sideways range. Excelerate Energy, another company in a sideways trend and approaching resistance, appears set to rise. If it breaks through the current resistance, the next – and final – resistance level awaits at spring price levels.
Conversely, Chevron tested resistance at its highest price levels, which have held so far. However, the price has remained close, and we will see whether it attempts another breakout or, conversely, rebounds.
PAN Ocean has been trying to break through similar resistance for the fifth week running, without success. The problem is that it is not enough to break through the resistance at closing prices; it must also overcome the ‘magnetic’ resistance at the all-time highs. And this zone is larger and stronger.
Tsakos has also risen to the resistance level of the high prices; we wrote about its inconspicuous rise within a sideways trend in a previous report. It is now trading below this resistance level and is preparing to attempt a breakout. There is magnetic resistance here too, but it consists of a single shadow and does not extend very far – its upper end is at $42.85.
ADNOC Logistics & Services (ADX: ADNOCLS) stalled at the resistance level of the all-time highs three weeks ago and failed to break through it, even with a 2.69 per cent rise.
Shell (NYSE: SHEL) gained 2.2 per cent. The resistance level it is trying to break through is the highest price seen this spring. So, if it breaks out, the path upward is clear.
Of the stocks trading in positive territory, only NYK Line (TSE: 9101), ALNG (OSE: ALNG) and Flex LNG (NYSE: FLNG) remain. NYK Line rose by 0.6 per cent, ALNG by 0.3 per cent and FLNG by 0.1 per cent. ALNG and FLNG are trading sideways, whilst NYK Line is consolidating at its highest prices for the second week running following strong previous gains. Fairly significant daily movements accompany this consolidation, though weekly movements are minimal. FLNG weathered the ex-dividend date without any issues.
The biggest fall was again in New Fortress Energy (NASDAQ: NFE), with the share price dropping 6.5 per cent.
Dynagas LNG Partners (NYSE: DLNG) fell 4.9 per cent, meaning the attempted breakout above resistance we anticipated did not materialise. The company is due to announce its second-quarter results on Tuesday 8 September.
Despite a 2.5 per cent decline, Korea Line Corporation (KRX: 005880) could attempt to rise, having set out the week before last to continue the upward trend that had only just begun. Although it lost ground last week, the candlestick pattern – and thus the trading action – looks positive. An attempt to push prices lower was repelled, and it ended the week near the opening price at the top of the range.
Three Asian companies saw similar declines. MISC (KLSE: 3816) and Mitsui O.S.K. Lines (TSE: 9104) fell by 1.4 per cent, whilst “K” Line (TSE: 9107) fell by 1.6 per cent. After all, NAKILAT (QSE: QGTS) was not far behind, falling by 1.3 per cent.
Despite volatile trading, MISC fell to its previous support level, which, however, lies outside the sideways trend. It had already paused at this price once in June after breaking below it.
MOL and “K” Line are trading at their highest prices, just like the aforementioned NYK Line; unlike NYK Line, however, they have fallen slightly more. This does not necessarily imply anything negative, though.
Last but not least is Capital Clean Energy Carriers (NASDAQ: CCEC). It, too, is trading sideways, and the -0.3 per cent movement is insignificant.
Crystal Ball
Qatar has been temporarily sidelined among the conflict’s losers because of industrial damage to its facilities, and the UAE seems to také its position. U.S. LNG exporters emerge as the clear winners. European importers were shielded from spot price increases thanks to predominantly long-term U.S. contracts. However, these contracts are not sufficient to replenish inventories for the winter, and European companies must return to the market despite Qatar’s continuing export restrictions. We expect most of the rising US gas production will flow towards Europe. New global LNG producers should also benefit from this conflict, as energy source diversification becomes more important than ever—provided importing economies remain healthy enough to absorb higher energy costs.
The outlook remains volatile, but positive in the long term. The gradual phasing out of steamers and the addition of new liquefaction capacity will continue to drive the sector forward.
About UPI
Established in 2020, the UP World LNG Shipping Index is a rules-based family of stock indices designed to measure the performance of publicly traded companies worldwide engaged in the maritime transportation of liquefied natural gas (LNG). This unique index comprises 21 companies and partnerships worldwide, representing more than 65% of the global LNG carrier fleet in 2020. The UP Index provides premium services, offering freemium and trial access to charts. With the Freemium plan, users can access the basic UP Index vs S&P 500 chart after completing email registration. The trial includes full access for fourteen days.
Final Note
This report primarily relies on technical analysis using weekly data. The summary section is AI-generated.
Disclosure: The author holds beneficial long positions in the shares of ALNG, FLNG, GLNG and NFE, whether through share ownership, options, or other derivatives. This report was prepared in-house and reflects our own opinions. We have received no compensation for it and have no business relationship with any company whose shares are mentioned herein.
Disclaimer: This report is provided for informational purposes only and does not constitute investment advice, nor a recommendation or solicitation to buy or sell any securities. It relies primarily on technical analysis using weekly data. Readers should conduct their own research and consult a qualified financial adviser before making any investment decisions.