
Summary
The UP World LNG Shipping Index fell for a third straight week, losing 4.84 points (2.08%) to close at 228.04. The headline tells only part of the story: breadth was almost even at 10:11, the median move was just −0.81%, and the weighted index (wUPI) actually rose by around 2% — the decline was concentrated in a few heavily weighted losers rather than across the board, and supporting indicators point to a correction within the uptrend. Volume was well below average. The two South Korean names led the gainers, with Pan Ocean surging above a long-standing resistance and Korea Line up 8.26%, while “K” Line (−5.4%), MISC (−4.08%) and COSCO (−3.93%) led the fallers, and New Fortress Energy slid to a fresh all-time-low close. In the background, the gas market kept stabilising: Asian LNG eased to around $25/MMBtu as Qatari exports crept higher, European storage entered October near 71% full, and spot tanker rates jumped to $31,500 (Atlantic) and $38,250 (Pacific).
UPI & SPX
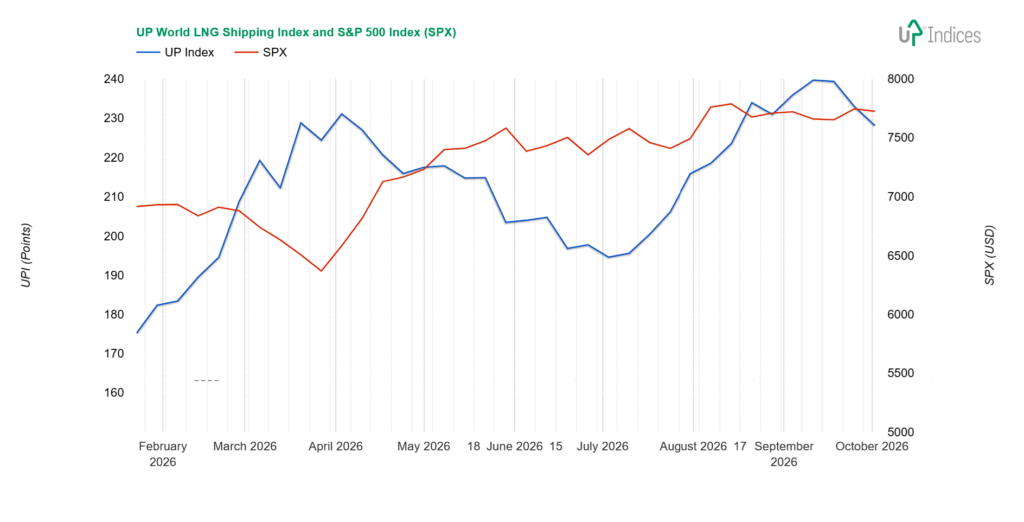
The UP World LNG Shipping Index, which tracks 21 listed LNG shipping companies, lost 4.84 points (2.08%), closing at 228.04 points, while the S&P 500 index lost 0.27%. The chart below illustrates the performance of both indices with weekly data.
Broader View
The UPI has declined for the third week running. Other indicators linked to the UPI suggest this is likely a correction in the upward trend rather than a change in trend.
The median change was -0.81 per cent, whilst the weighted index (wUPI) actually rose by two per cent. The ratio of rising to falling index components was 10:11. Trading volume was significantly below average.
The gas market appears to be stabilising. A weekly Reuters round-up reports that Asian LNG prices have fallen for the second week running and are holding steady at around $25 per MMBtu. This has been driven by rising exports of Qatari gas; whilst these are still far from pre-war levels, every tanker helps to ease the increased demand.
More LNG cargoes from Ras Laffan in Qatar have transited the strait in recent weeks, with many vessels making ‘dark transits’ by switching off their Automatic Identification System (AIS) transponders to avoid detection.
The number of LNG cargoes exiting the waterway in September rose to its highest monthly level since the US-Israeli war on Iran began, according to data from analytics firms. These levels, however, are still significantly below pre-war shipment volumes.
“European gas markets remained relatively supported by storage concerns, whilst LNG prices faced downward pressure relative to gas due to ample cargo offers for Q4,” Blakeway said, adding that Europe’s storage facilities entered October at around 71 per cent full – well below seasonal norms – reinforcing expectations of strong LNG imports throughout the winter.
Spot rates rose to $31,500 per day for the Atlantic and to $38,250 per day for the Pacific, Reuters quoted Spark Commodities as saying.
Constituents
Although the UPI was falling, Pan Ocean (KRX: 028670) posted double-digit growth, which helped the share price break through resistance. Whilst the price closed within the magnetic resistance zone, the slightly higher trading volume suggests that the rally could continue. The price had been hovering near this resistance level since late summer, but had never closed above it – until last week.
The second South Korean company in the index – Korea Line Corporation (KRX: 005880) – rose by 8.26 per cent. Tsakos Energy Navigation (NYSE: TEN) moved in the same direction.
KLC also reached resistance, although this is significantly lower than the spring highs. It had not yet been clear whether KLC was forming a new uptrend or whether the rise was merely a correction to a downtrend. After last week’s performance, and especially after closing above the resistance level, a new attempt at an uptrend is more likely.
TEN is also continuing its uptrend; following a one-week correction, it is heading towards short-term resistance.
Dynagas LNG Partners (NYSE: DLNG) rose by 5.9 per cent, though the trend here is sideways.
Three companies recorded gains of more than one per cent: BP (NYSE: BP; +1.45 per cent), Flex LNG (NYSE: FLNG; +1.17 per cent) and Chevron (NYSE: CVX; +1.1 per cent).
BP continues to bounce off support and is close to the upper limits of this year’s highs. FLNG once again held the $30 mark and strengthened within its sideways trend. Chevron appears to have completed a brief correction in its uptrend and should start rising again.
The last three rising companies added just tenths of a per cent. Shell (NYSE: SHEL) gained just under half a per cent, holding steady near this year’s highs and poised to attempt another rise.
Mitsui O.S.K. Lines (TSE: 9104) gained 0.44 per cent, the most of the Japanese trio. It, too, is trading in a narrow range near its highs and is poised to attempt another breakout higher.
Exmar (EBR: EXM) is also trading sideways near its highs, albeit on minimal volume.
The biggest fall, down 5.4 per cent, was seen in “K” Line (TSE: 9107). It is also trading near its highs but has now fallen to the level of magnetic support, meaning it has broken through the support formed by the candle bodies.
MISC (KLSE: 3816; -4.08 per cent) and COSCO Shipping Energy Transportation (SS: 600026; -3.93 per cent) fell by around four per cent. MISC’s decline confirmed the downtrend, but the fall has created a congested area, and it is difficult to predict how it will proceed. We believe this represents a shift between individual price ranges. COSCO fell for the second week in a row, but this is a correction within an uptrend. On the other hand, it also signals a rejection of a return to the range seen in the spring.
Three companies lost more than three per cent: New Fortress Energy (NASDAQ: NFE; -3.67 per cent), Capital Clean Energy Carriers (NASDAQ: CCEC; -3.49 per cent) and NYK Line (TSE: 9101; -3.04 per cent). For NFE, the decline is small given its volatility, yet it still fell to a new all-time-low close. CCEC posted a 12 per cent fall during the week, which it corrected the very next day, and continues to fluctuate within a sideways trend. NYK Line is holding near its highs and testing the upper limits of this range.
ADNOC Logistics & Services (ADX: ADNOCLS) fell by 2.49 per cent from its highs. Although the decline has been ongoing for two weeks, it has not been significant so far.
Excelerate Energy (NYSE: EE; -1.66 per cent) and Nakilat (QSE: QGTS; -1.27 per cent) are both down by between one and two per cent. Excelerate reached a support level, which was tested, but the price has since rebounded above it. A similar situation applies to Nakilat, but its support is more fragile, consisting of the opening price from the week before last and a fairly long-standing support level dating back to early April.
Two companies remain with falls of less than one per cent: ALNG (OSE: ALNG; -0.9 per cent) and Golar LNG (NASDAQ: GLNG; -0.8 per cent). ALNG continues to trade sideways, whilst Golar tested the lower boundary of its sideways trend and even broke through it. However, the price has since returned to the range.
Crystal Ball
Qatar remains sidelined among the conflict’s losers — but the key constraint is export, not production. The damage to Ras Laffan removed around 17% of capacity (two of 14 trains), which QatarEnergy expects to take three to five years to repair. The remaining ~80% of capacity is intact and could, in principle, return to market — but the Strait of Hormuz is Qatar’s sole export route, and executives (including Shell’s) caution that even a reopening would not restore pre-war flows overnight, as high war-risk insurance continues to deter tanker returns to the Gulf. For now, this keeps a large share of Qatari volume bottled up, and US LNG exporters emerge as the clear winners. European importers were shielded from spot price increases largely because of long-term US contracts; however, these are not enough to replenish winter inventories, and European companies must return to the market despite Qatar’s continuing export restrictions. We expect most of the rising US gas production to flow toward Europe. New global LNG producers should also benefit, as energy source diversification becomes more important than ever — provided importing economies remain healthy enough to absorb higher energy costs. The outlook remains volatile, but positive in the long term. The gradual phasing out of steam vessels and the addition of new liquefaction capacity will continue to drive the sector forward.
About UPI
Established in 2020, the UP World LNG Shipping Index is a rules-based family of stock indices designed to measure the performance of publicly traded companies worldwide engaged in the maritime transportation of liquefied natural gas (LNG). This unique index comprises 21 companies and partnerships worldwide, representing more than 65% of the global LNG carrier fleet in 2020. The UP Index provides premium services, offering freemium and trial access to charts. With the Freemium plan, users can access the basic UP Index vs S&P 500 chart after completing email registration. The trial includes full access for fourteen days.
Final Note
This report primarily relies on technical analysis using weekly data. The summary section is AI-generated.
Disclosure: The author holds beneficial long positions in the shares of ALNG, FLNG, and NFE, whether through share ownership, options, or other derivatives. This report was prepared in-house and reflects our own opinions. We have received no compensation for it and have no business relationship with any company whose shares are mentioned herein.
Disclaimer: This report is provided for informational purposes only and does not constitute investment advice, nor a recommendation or solicitation to buy or sell any securities. It relies primarily on technical analysis using weekly data. Readers should conduct their own research and consult a qualified financial adviser before making any investment decisions.