
Audio summary
Summary
The UP World LNG Shipping Index gained 0.53 points (0.26%) last week, closing at 203.97 points, while the S&P 500 fell 2.59%. The UPI has slowed its decline and is now trading between its short-term and long-term moving averages. At the same time, the weighted index recorded a stronger 2.47% gain, signalling that the larger constituents drove the index higher. The ratio of advancing to declining stocks was 9:10 with one unchanged, and trading volume was significantly below average. Geopolitics remains the main market driver: gas continues to flow to Asia, where Chinese demand is pushing prices higher, while Pakistan is among the countries most affected by the closure of the Strait of Hormuz.
The Japanese trio led the gainers, with “K” Line up 7.2%, Mitsui O.S.K. Lines nearly 6%, and NYK Line 5.6% — all benefiting from technical breakouts and rebounds from previous ranges. Chevron and BP each rose around 2.6%, while Exmar added 2.65% and Golar LNG gained 1.85%, supporting the weighted index. New Fortress Energy was the biggest decliner, down 10.34% and falling to new lows. Korea Line Corporation lost 9.8% on very low volume, breaking through support, while COSCO Shipping Energy Transportation declined further. ADNOC Logistics & Services fell 4.67% within its sideways range, and Nakilat dropped 2.8%. The long-term outlook remains positive.
UPI & SPX
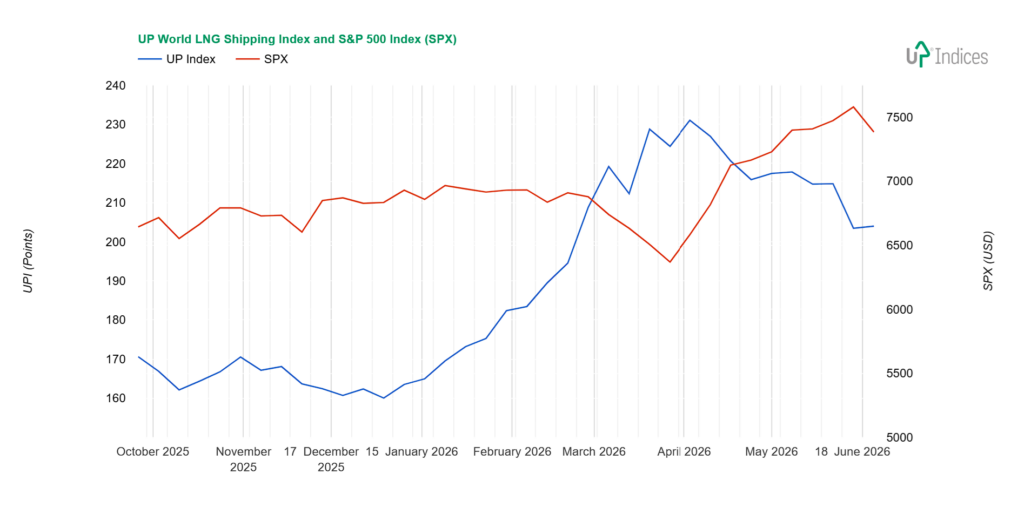
The UP World LNG Shipping Index, which tracks 20 listed LNG shipping companies, gained 0.53 points (0.26%), closing at 203.97 points, while the S&P 500 index lost 2.59%. The chart below illustrates the performance of both indices with weekly data.
Broader View
The UPI has slowed its decline and is trading between the short-term (10-day MA, equivalent to 50 days) and long-term (40-day MA, equivalent to 200 days) moving averages. While the shorter-term average is turning downward, the long-term average continues to rise and is now below 190 points. The UPI continues to benefit from the strong rally that began at the turn of the year, when it broke out of a sideways range with an upper limit slightly above 170 points.
The ratio of advancing to declining stocks was 9:10 (one unchanged), and the weighted UPI (wUPI) even recorded a 2.47% increase. Trading volume was significantly below average.
We expect the UPI to move with increased volatility, establishing new resistance levels in this new range, just as it did last week. However, it should remain above the long-term moving average. We will continue to monitor both averages in our Chart of the Week section.
Geopolitics remains the main driver of the markets. Gas continues to flow to Asia, which has seen further increases in gas prices due to increased Chinese demand, according to Reuters. European purchases remain outside of spot orders. In contrast, Pakistan was recently forced to overpay for all spot supplies and is thus considered one of the countries most affected by the closure of the Strait of Hormuz.
Constituents
The positive performance of the UPI was driven mainly by Japanese companies, all of which saw significant gains: “K” Line (TSE: 9107) led the week with the largest gain, rising 7.2%. In second place was Mitsui O.S.K. Lines (TSE: 9104) with nearly 6% growth, followed closely by NYK Line (TSE: 9101) with a 5.6% increase. While “K” Line broke out from a support zone, easily surpassing the resistance of this narrow range, MOL and NYK Line capitalised on a rebound from the 2024–2025 range, which had previously served as a ceiling. At the same time, “K” Line and NYK Line approached the average trading volume.
Chevron (NYSE: CVX) and bp (NYSE: BP) posted nearly identical performance, both rising by 2.6%, or a few tenths of a percentage point. While Chevron is trading in a sideways range, BP corrected the decline from the week before last, and its attempt at more significant growth was rejected. Exmar (EBR: EXM) rose by 2.65% and is moving back toward the 2025 low price range.
Golar LNG (NASDAQ: GLNG) added 1.85%, undoubtedly contributing to the index’s positive result given its weight. It is moving back toward the support level, but its return to it has not been successful. The downward breakout from the week before last thus still holds, and the price is somewhat floating and unanchored in this space.
Shell (NYSE: SHEL, +1.52%) is still attempting to rise but, again, unsuccessfully, and the price remains near support.
MISC (KLSE: 3816) also continued its sideways movement, this time up 0.6%.
If we disregard New Fortress Energy’s (NASDAQ: NFE) 10.34% drop to new lows, the companies closest to a double-digit decline were Korea Line Corporation (KRX: 005880) and COSCO Shipping Energy Transportation (SS: 600026). For KLC, the 9.8% decline marked a break below support, though on very low volume. For COSCO, this confirmed the breakout from the week before last and occurred on normal volume.
ADNOC Logistics & Services (ADX: ADNOCLS) lost 4.67%, but the move remained within a sideways range.
Conversely, NAKILAT (QSE: QGTS) fell 2.8%, dropping back below the support level it first reached in March of this year. The performance of both companies clearly illustrates the significant negative impact of geopolitical events.
Excelerate Energy (NASDAQ: EE) lost 2.16% and moved to the edge of the support zone.
Tsakos Energy Navigation (NYSE: TEN) fell by 1.54%, marking a continued, albeit slower, decline from the previous drop.
Dynagas LNG Partners (NYSE: DLNG) also fell by 1%, with minor fluctuations continuing to offset the trend.
Awilco LNG (OSE: ALNG) changed its name to ALNG, appointed a new interim CEO, and issued new shares in a secondary offering. The -0.3% move is at the edge of support.
Capital Clean Energy Carriers (NASDAQ: CCEC) fell by 0.13%, but attempted to rise again during the week. Just like the week before last, the attempt was rejected, but the price remains poised at the upper levels for a new attempt. It is important to note that both attempts brought above-average volume, so this is a truly significant level.
FLEX LNG (NYSE: FLNG) remained unchanged; it also attempted a corrective rally to mitigate the post-dividend drop, but this was rejected.
Crystal Ball
Despite the decline, the overall outlook remains unchanged. The second quarter is typically the weakest seasonally, but this year will be different—geopolitical circumstances have knocked nearly 20% of global LNG production offline. While Europe still enjoys a certain advantage over Asia, it now needs gas, and rising prices are hitting the poorest consumers, such as those in Bangladesh, the hardest.
The shortfall in supplies will have to be replaced. We view the return to coal as temporary; we expect a gradual increase in spot supplies and greater geographic diversification of sources, which will bring longer shipping routes and higher demand for tankers. Carriers operating on the US–Europe or Australia–Asia routes are in a more stable position.
The outlook remains volatile, but positive in the long term. Companies with spot tankers are benefiting from high rates and longer distances. The gradual phasing out of steamers and the addition of new liquefaction capacity will continue to drive the sector forward.
About UPI
Established in 2020, the UP World LNG Shipping Index is a rules-based family of stock indices designed to measure the performance of publicly traded companies worldwide engaged in the maritime transportation of liquefied natural gas (LNG). This unique index comprises 20 companies and partnerships worldwide, representing more than 65% of the global LNG carrier fleet in 2020. The UP Index provides premium services, offering freemium and trial access to charts. With the Freemium plan, users can access the basic UPI vs S&P 500 chart after completing email registration. The trial includes full access for fourteen days.
Final Note
This report primarily relies on technical analysis using weekly data. The summary section is AI-generated.