Summary
The UP World LNG Shipping Index lost 4.40 points (1.92%), closing at 224.37 points, while the S&P 500 fell 2.12%. Despite a favourable ratio of gainers to decliners of 13:7, the decline was driven by larger index constituents, which either fell more sharply or rose only modestly — reflected in a median price change of just +0.66%. Trading volume remains well above average.
The convergence of European and Asian gas prices has temporarily closed the price arbitrage, pulling spot tanker rates lower: Atlantic rates fell to $96,500/day and Pacific rates to $108,000/day, according to Spark Commodities. Gas prices remain significantly above pre-war levels, at around $19.30/mmBtu in Asia and €55/MWh at the TTF hub in Europe. New Fortress Energy continued its post-restructuring slide, losing 21.8%, while Nakilat fell 8.45% amid the ongoing inability to export Qatari LNG. On the positive side, Tsakos Energy Navigation led the gainers with +6.89%, followed by Exmar (+6%). In comparison, Golar LNG added 4.48% — supported by its announcement that Goldman Sachs has been retained to explore strategic alternatives, including a potential sale of the company. The short-term outlook remains volatile; long-term fundamentals stay positive.
UPI & SPX
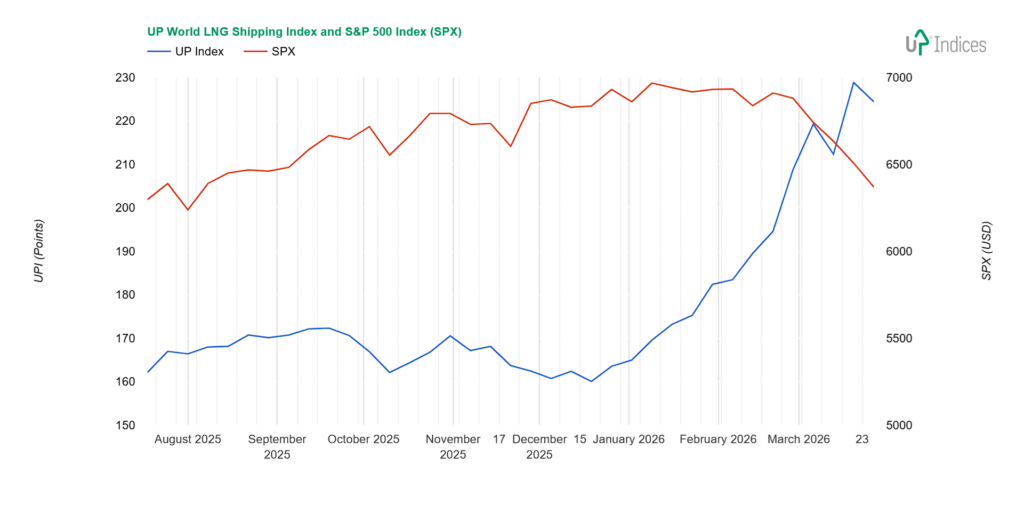
The UP World LNG Shipping Index, which tracks 20 listed LNG shipping companies, lost 4.40 points (1.92%), closing at 224.37 points, while the S&P 500 index lost 2.12%. The chart below illustrates the performance of both indices with weekly data.
Broader View
The UPI recorded its second decline this year, even though the ratio of rising to falling stocks was 13:7. The decline was driven by larger stocks, which either fell more sharply or rose only slightly. This is also reflected in the median change of +0.66%. Trading volume remains well above average.
The Middle East continues to be the main driver of market changes. Gas prices have declined, but not significantly. The gap between gas prices in Europe and Asia has temporarily stopped narrowing—we believe this is only a pause—leading to a fall in spot tanker rates, with more tankers staying in the Atlantic. Meanwhile, Asia is shifting to fuels other than gas, mainly coal, although this is not a sustainable long-term solution.
From Friday’s Reuters energy roundup, we quote: “Asia: The average LNG price for May delivery into northeast Asia was estimated at $19.30/mmBtu, down $6 from $25.30/mmBtu in the previous week. In Europe, gas prices at the Dutch TTF hub were hovering around 55 euros per megawatt-hour on Friday afternoon, 72% higher than pre-war levels, which is $18.444/mmBtu, according to S&P Global Energy. Atlantic spot rates at $96,500/day, Pacific at $108,000/day according to Spark Commodities.”
Constituents
New Fortress Energy (NASDAQ: NFE) continues to decline following its restructuring announcement. It lost 21.8% last week.
Nakilat (QSE: QGTS) also declined by 8.45%. The reason, of course, is the inability to export Qatari LNG.
NYK Line (TSE: 9101), in third place, fell by “only” 3.97%, correcting its previous strong growth. At the same time, a larger decline was avoided during the week, so the resulting weekly candle is positive despite the drop.
Awilco LNG (OSE: ALNG) continues to await confirmation of the announced expansion of operations and the entry of a new investor at the general meeting scheduled for Monday, 30 March. The extraordinary general meeting approves all proposals. Over the past week, the company’s share price changed by -2.58%.
MISC (KLSE: 3816) fell by just under one per cent, completing its pullback from the rally triggered by the attack on Iran.
Only two minor declines remain. Dynagas LNG Partners (NYSE: DLNG) fell by 0.7% and “K” Line (TSE: 9107) by 0.4%. For both, the weekly candle shows a positive (i.e., bullish) pattern due to rejection of lower prices.
Conversely, Tsakos Energy Navigation (NYSE: TEN) posted the largest gain, increasing by 6.89%. The price broke out of the sideways movement of recent weeks but remained below the highest point reached solely by the wick of the candle from this range.
Exmar (EBR: EXM) also posted a 6% gain.
Three companies posted 4% gains. Chevron (NYSE: CVX) increased by 4.67%, Golar LNG (NASDAQ: GLNG) rose by 4.48%, and BP (NYSE: BP) advanced by 4.24%. Both CVX and BP are driven by the inability to export oil and gas from the Gulf. GLNG is also benefiting from this situation; it has also announced that it has retained Goldman Sachs to explore options, including a sale of the entire company, a merger, or the divestment of certain assets. The aim is to accelerate the development of FLNG technology and maximise shareholder value.
The most recent notable increase was observed in Capital Clean Energy Carriers (NYSE: CCEC), which rose by 2.93% and is currently trading within the support zone of a sideways trend.
The third member of the oil-and-gas trio, Shell (NYSE: SHEL), increased by 1.91%. The actual gain was larger, but the opening price was considerably lower than the week’s previous closing price. Nonetheless, it managed to surpass the negative sentiment from the week before last, which featured a small body and a long wick.
Excelerate Energy (NYSE: EE) rose 1.4%, but the candlestick shows a negative signal. The price is near previous lows, and a stronger rise was rejected during the week.
Other movements were less than 1%, including ADNOC Logistics & Services (ADX: ADNOCLS), Mitsui O.S.K. Lines (TSE: 9104), and Korea Line Corporation (KRX: 005880). While MOL has a bullish tone for the week by rejecting the decline, Korea Line Corporation continues to weigh its next move.
Crystal Ball
The outlook remains volatile and unpredictable. Companies with spot LNG tankers are maintaining positive momentum, benefiting from high spot rates and increased distances.
The long-term outlook remains positive. The scrapping of steam vessels and the addition of new liquefaction capacity are pushing the sector higher.
About UPI
Established in 2020, the UP World LNG Shipping Index is a rules-based family of stock indices designed to measure the performance of publicly traded companies worldwide engaged in the maritime transportation of liquefied natural gas (LNG). This unique index comprises 20 companies and partnerships worldwide, representing more than 65% of the global LNG carrier fleet in 2020. The UP Index provides premium services, offering freemium and trial access to charts. With the Freemium plan, users can access the basic UPI vs S&P 500 chart after completing email registration. The trial includes full access for fourteen days.
Final Note
This report primarily relies on technical analysis using weekly data. The summary section is AI-generated.