
Summary
The UP World LNG Shipping Index fell 6.39 points (2.67%) in Week 39-2026 to close at 232.88, sliding back toward its August support. Breadth was sharply negative — just 3 of 21 constituents rose against 18 decliners, with a median move of −2.17% — though the weighted index held up better (wUPI −1.39%) and volume ran below average. The driver was again geopolitics: renewed expectations of an imminent Iran resolution drained the crisis premium, even as weekend news pointed back toward disappointment. The gas market cooled in parallel, with Asian prices retreating from four-year highs to $25.85/MMBtu as Northeast Asia enters winter well-covered; European storage climbed above 70%, easing winter-supply concerns. Expectations of higher Qatari exports — signalled by a rise in “dark” transits near Hormuz — added downward pressure. Spot tanker rates firmed to $29,500 (Atlantic) and $31,000 (Pacific).
The damage was concentrated. New Fortress Energy collapsed by more than 44%, and Tsakos Energy Navigation gave back 11.2% from its highs on above-average volume, while Excelerate Energy lost 8.13% after breaching its $35 support. A cluster of names fell around 4% (FLEX LNG, Golar, Dynagas) and 3% (COSCO, Pan Ocean), with the three Japanese majors, Korea Line and MISC down more modestly by around 1–2% and still near their highs. Only three constituents advanced: ALNG (+2.78%), Shell (+1.06%) and Capital Clean Energy Carriers. The short-term picture has softened as the geopolitical premium eased; the long-term case — steam-vessel retirements and new liquefaction capacity — remains intact.
UPI & SPX
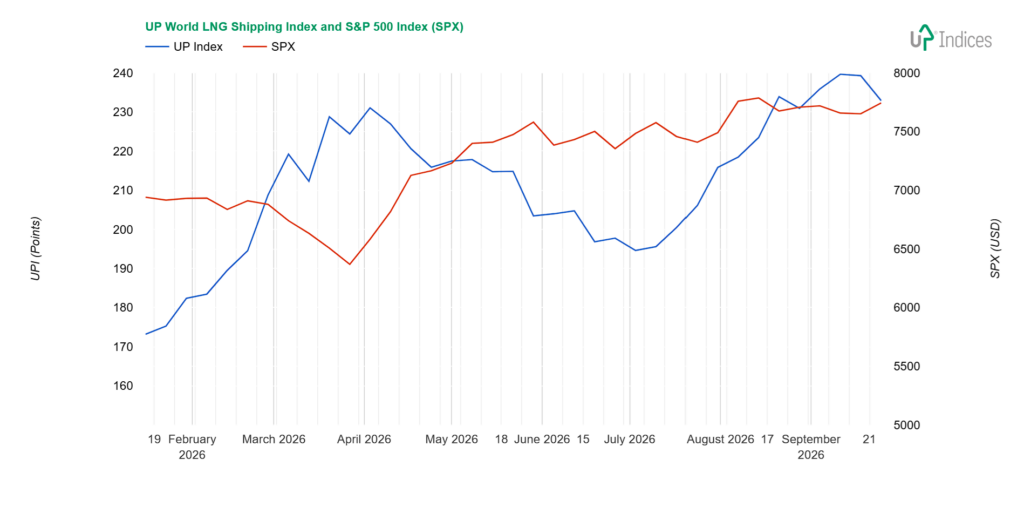
The UP World LNG Shipping Index, which tracks 21 listed LNG shipping companies, lost 6.39 points (2.67%), closing at 232.88 points, while the S&P 500 index gained 1.21%. The chart below illustrates the performance of both indices with weekly data.
Broader View
The UPI weakened significantly and fell close to its August support level. The main driving force was geopolitics, suggesting (once again) an imminent resolution to the crisis surrounding Iran. As fans of the non-existent Czech genius Jára Cimrman know, the phase of anticipation is followed by a phase of disappointment. And this appears to be the case this time too, at least according to the weekend’s news. However, this had no impact last week. Time and the weather remain factors to be reckoned with.
The ratio of rising to falling companies was 3:18, the median movement was -2.17 per cent, and the weighted wUPI index fell by 1.39 per cent. Trading volume was below average.
According to Reuters’ weekly summary, the gas market was also going through a phase of anticipation. Asian prices fell from four-year highs back to $25.85 per MMBtu.
“Northeast Asia is largely covered heading into this winter,” said ICIS analyst Evan Tan, noting that Japan’s inventories are
healthy and that any pre-winter restocking by South Korea is likely to be limited by expectations of mild weather.
China has also stayed out of the spot market as cheaper domestic gas makes LNG uneconomical, with South Asia doing most of the prompt buying, he added.
Expectations of higher Qatari exports have also weighed on prices, following an increase in dark transits by QatarEnergy vessels in recent weeks, said Martin Senior, head of LNG pricing at Argus.
“Many of the firm’s older carriers are now positioned near the Strait of Hormuz, or have their Automatic Identification System transponders switched off – both signs that the firm could continue these transits,” he said.
In Europe, prices remain around $24.6 per MMBtu.
“European storage inventories rose above 70 per cent during the week, reducing immediate concerns about winter preparedness,” said Aly Blakeway, head of Atlantic LNG at S&P Global Commodity Insights.
Strong LNG imports, healthy send-out rates and seasonally weak demand helped ease near-term supply concerns, leaving ample cargo availability across both prompt and forward delivery windows, Blakeway added.
According to Spark Commodities, spot prices have converged, standing at $29,500 per day for the Atlantic and $31,000 per day for the Pacific.
Constituents
Despite the large number of companies seeing their share prices fall, the declines were not significant in most cases. New Fortress Energy (NASDAQ: NFE) shares fell the most, losing over 44 per cent over the week.
The second double-digit fall of the past week was recorded by Tsakos Energy Navigation (NYSE: TEN; -11.2 per cent). The decline took the share price back from its highs toward the start of the support zone, which may indicate a temporary fall. However, trading volume was above average.
Excelerate Energy (NYSE: EE) lost 8.13 per cent, also falling close to its support level. Although trading volume was above average here too, a large proportion was accumulated at the start of the week, when the intermediate support level at $35 was breached.
Among the larger declines, we can also note three 4 per cent drops. FLEX LNG (NYSE: FLNG) lost 4.75 per cent within its sideways range and, on average volume, also slipped towards the first support zone at $30. The second, and more significant, support zone is at $29.25.
Golar LNG (NASDAQ: GLNG) lost 4.25 per cent, though this merely brings it closer to the support level within the sideways range.
Dynagas LNG (NYSE: DLNG) lost 4 per cent and is now at last year’s support level. As it briefly but repeatedly dipped below this level during the summer, the decline may continue.
Two Asian stocks fell by 3 per cent: COSCO Shipping Energy Transportation (SS: 600026) and Pan Ocean (KRX: 028670). COSCO took a breather following its successful return to the spring’s high-price range. Pan Ocean is trading below this year’s highs; the current decline has brought it into a magnetic support zone within this part of the range.
There were also four stocks with declines starting with the number two: Exmar (EBR: EXM; -2.51 per cent), NAKILAT (QSE: QGTS; -2.44 per cent), Chevron (NYSE: CVX; -2.42 per cent) and ADNOC Logistics & Services (ADX: ADNOCLS; -2.17 per cent).
Exmar has fallen back to the upper edge of the broken range, keeping hopes alive for another attempt at an uptrend.
The question is whether NAKILAT reacted to geopolitical circumstances, the successful passage of three tankers through the Strait of Hormuz, or bounced off the support level. It is likely to be a combination of all three factors, which, as often happens in technical analysis, have coincided. We shall see the truth as events unfold.
Chevron failed to hold above its spring highs and fell for the second time in a row. The question is whether this marks the end of the rally or merely a pause in the uptrend. We are leaning towards the latter.
ADNOC has continued its correction from its peak prices for the second week running, though this is most likely merely a correction within an uptrend.
Five companies saw falls of between less than two per cent and more than one per cent: all three Japanese firms, Korea Line Corporation and MISC.
Mitsui O.S.K. Lines (TSE: 9104; -1.85 per cent), like NYK Line (TSE: 9101; -1.67 per cent) and “K” Line (TSE: 9107; -1.32 per cent), remains close to both this year’s and all-time highs. Unlike the other two, MOL has formed a small sideways range here. The other two are still pushing upwards more vigorously, and their charts have resembled a staircase in recent weeks.
Korea Line Corporation (KRX: 005880) fell by 1.68 per cent and has now seen small declines for the fourth week running.
MISC (KLSE: 3816) is trading above the support level within a sideways range.
BP (NYSE: BP) suffered the smallest loss of the week, falling by 0.96 per cent. Although the loss was greater at times during the week, the price ultimately held within the spring price range, albeit close to support.
Only three companies posted gains: ALNG (OSE: ALNG; 2.78 per cent), Shell (NYSE: SHEL; 1.06 per cent) and Capital Clean Energy Carriers (NASDAQ: CCEC).
ALNG continues to move sideways, this time rising near the support level. Shell has remained within a separate group of three candlesticks. This week, the upward gap closed, and price returned to this ‘island’. CCEC is also continuing to move sideways, with a fairly wide trading range. This time, the price rebounded from one of the internal support levels in the upper half of this range.
Crystal Ball
Qatar remains sidelined among the conflict’s losers — but the key constraint is export, not production. The damage to Ras Laffan removed around 17% of capacity (two of 14 trains), which QatarEnergy expects to take three to five years to repair. The remaining ~80% of capacity is intact and could, in principle, return to market — but the Strait of Hormuz is Qatar’s sole export route, and executives (including Shell’s) caution that even a reopening would not restore pre-war flows overnight, as high war-risk insurance continues to deter tanker returns to the Gulf. For now, this keeps a large share of Qatari volume bottled up, and US LNG exporters emerge as the clear winners. European importers were shielded from spot price increases largely because of long-term US contracts; however, these are not enough to replenish winter inventories, and European companies must return to the market despite Qatar’s continuing export restrictions. We expect most of the rising US gas production to flow toward Europe. New global LNG producers should also benefit, as energy source diversification becomes more important than ever — provided importing economies remain healthy enough to absorb higher energy costs. The outlook remains volatile, but positive in the long term. The gradual phasing out of steam vessels and the addition of new liquefaction capacity will continue to drive the sector forward.
About UPI
Established in 2020, the UP World LNG Shipping Index is a rules-based family of stock indices designed to measure the performance of publicly traded companies worldwide engaged in the maritime transportation of liquefied natural gas (LNG). This unique index comprises 21 companies and partnerships worldwide, representing more than 65% of the global LNG carrier fleet in 2020. The UP Index provides premium services, offering freemium and trial access to charts. With the Freemium plan, users can access the basic UP Index vs S&P 500 chart after completing email registration. The trial includes full access for fourteen days.
Final Note
This report primarily relies on technical analysis using weekly data. The summary section is AI-generated.
Disclosure: The author holds beneficial long positions in the shares of ALNG, FLNG, and NFE, whether through share ownership, options, or other derivatives. This report was prepared in-house and reflects our own opinions. We have received no compensation for it and have no business relationship with any company whose shares are mentioned herein.
Disclaimer: This report is provided for informational purposes only and does not constitute investment advice, nor a recommendation or solicitation to buy or sell any securities. It relies primarily on technical analysis using weekly data. Readers should conduct their own research and consult a qualified financial adviser before making any investment decisions.