
Summary
The UP World LNG Shipping Index reversed its downtrend, gaining 1.39 points (0.65%) to close at 217.13, while the S&P 500 rose 2.51% in a week that snapped a four-week losing streak. (The report also carries a correction to the UPI calculation for the prior two weeks — see the note below.) The recovery was broad — breadth 13:8, median +3.42% — though volume stayed below average and the week split into a soft first half and a firmer second. Korea Line led the gainers (+5.57%), with Tsakos +5.51%, Exmar +4.93% and the Japanese trio around 4%. Excelerate (+3.48%) continued toward the $40 mark, and the oil & gas majors rebounded off support (Chevron +3.42%, BP and Shell firmer). The clear laggard was New Fortress Energy, down 17.59% within its range, with COSCO −4.44% (fifth down week) and MISC −3.6%. In the background, gas markets stayed tight: Asian prices eased but held near a four-year high, European prices rose on colder weather and low storage (71.6% full, ~18 points below the five-year average), and tanker rates eased after a three-week run — Atlantic to $31,000, Pacific to $54,500. The updated Crystal Ball notes Poland’s Orlen became the first buyer to cancel its QatarEnergy contract amid the disruptions.
Correction
Due to an error in the UPI calculation, several published index values for the weeks ending 6 and 13 November were incorrect: Friday closing prices for some non-US listings had been replaced with Thursday prices, and the weight-reduction factors for Nakilat and Golar LNG were calculated using the wrong date. These feed directly into the index, so the published UPI values were wrong. The corrected closes are 215.74 on 6 November (−5.95%, previously 220.05) and 217.13 on 13 November (+0.65%, previously 215.93); the 30 October value (229.39) is unchanged. Note the 6 November move was therefore larger, not smaller, than first reported. The index rules and methodology are unaffected — this was a data-input error in the calculation, now corrected, and we have added a closing-date check to prevent a recurrence. We apologise for the error and thank you for your understanding.
UPI & SPX
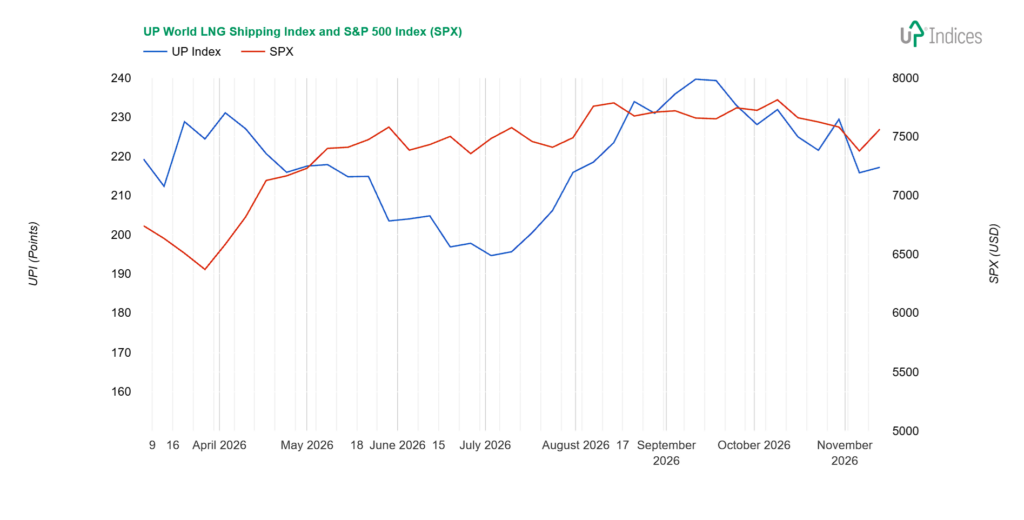
The UP World LNG Shipping Index, which tracks 21 listed LNG shipping companies, gained 1.39 points (0.65%) to close at 217.13 points, while the S&P 500 index gained 2.51%. The chart below illustrates the performance of both indices with weekly data.
Broader View
The UPI reversed its downward trend. Trading volume continues to fall and remains below average. The median price change was 3.42 per cent, whilst the weighted wUPI index rose about one per cent. The ratio of rising to falling index components was 13:8.
The week was divided into two parts: it started on a negative note, but the second half was predominantly positive.
The Reuters weekly summary notes that whilst gas prices in Asia fell slightly compared with last week, they rose in Europe. This, combined with current and forecast colder weather and ongoing tensions in the Strait of Hormuz, is keeping gas prices high.
European demand for LNG imports is driving up spot rates for LNG tankers travelling to Asia.
Asian spot LNG prices edged lower this week but remained near a four-year high as uncertainty over US-Iran diplomacy and low European storage levels kept the market tight.
“The market remains extremely sensitive to diplomatic efforts in the Middle East, with a recent pullback indicating renewed potential developments,” said Toby Copson, managing partner at Davenport Energy.
Cargo flows through the strait have improved this month, with 16 shipments so far in November compared with 26 in the whole of October, indicating a faster pace, said Martin Senior, head of LNG pricing at Argus.
Spot demand is concentrated in South and South-East Asia, whilst buyers in North-East Asia have largely remained on the sidelines, he added.
“Competition from Europe for the tight supply is likely to intensify now that weather forecasts do not appear to be predicting a prolonged spell of mild weather,” said Klaas Dozeman, market analyst at Brainchild Commodity Intelligence, adding that this would accelerate withdrawals from storage, which is expected to fall below 70 per cent next week.
European storage remains a key pillar of market support, with inventories at 71.6 per cent of capacity on 10 November, almost 18 percentage points below the five-year average, said Aly Blakeway, head of Atlantic LNG at S&P Global Energy.
In LNG shipping, Atlantic freight rates fell to $31,000 a day, and Pacific rates eased to $54,500 a day, ending a three-week run of gains in both basins, said Spark Commodities analyst Qasim Afghan.
Constituents
None of the growth figures was in double figures, and almost all remained at very similar levels, specifically in the range of approximately 2.5–5.5 per cent.
Korea Line Corporation (KRX: 005880) recorded the largest gain, rising by 5.57 per cent. KLC rebounded from its support level, with the upper boundary of the sideways range lying below 2,100 won.
Tsakos Energy Navigation (NYSE: TEN), up 5.51 per cent, came in second place. Its movement from the opening to the closing price took place within the support zone of the current sideways trend. This means there remains a good chance of another attempt at an uptrend.
Belgian firm Exmar (EBR: EXM) gained almost five per cent, specifically 4.93 per cent. This was enough to move the share price along the sideways range towards its upper boundary.
The Japanese trio continues to move more or less in sync; this time, the gain was around 4 per cent. Mitsui O.S.K. Lines (TSE: 9104; 4.77 per cent), NYK Line (TSE: 9101; 4.22 per cent) and “K” Line (TSE: 9107; 4.22 per cent) recovered from their previous decline, having also traded in negative territory during the week. Ultimately, however, these declines left only a faint trace on the weekly chart.
Four constituents posted three per cent gains: Excelerate Energy (NYSE: EE; 3.48 per cent), Chevron (NYSE: CVX; 3.42 per cent), Dynagas LNG Partners (NYSE: DLNG; 3.27 per cent) and Pan Ocean (KRX: 028670).
EE continues to rise after entering a higher sideways range the week before last. It now faces an attempt to break through and close above the $40 mark, which has so far proved beyond its reach. Only then will the $43 mark – its all-time high – come into view.
Chevron has climbed back above resistance and to the upper reaches of its all-time highs following positive news from South America. Uncertainty regarding oil and gas supplies naturally works in its favour; on the other hand, higher share prices driven by rising oil and gas prices mean greater volatility.
Dynagas partially recovered from its previous decline. It erased the entire loss over the course of the week, though investors were not entirely confident. The price thus remains below the long-term resistance level (previously a reliable support level) of $3.30.
Pan Ocean also held its ground at the support level.
BP, much like Chevron, recovered from its recent decline, but this was more a confirmation of support than a move towards an upward trend. The same applies to it as to CVX; however, according to technical analysis, the path upwards is more complicated due to resistance in the $47–$48 range.
Another rising stock was ALNG (OSE: ALNG), which gained 1.88 per cent within a sideways trading range. It has thus reached its current resistance level, though breaking above it is by no means a foregone conclusion. The range in which the company traded in the spring, amidst rising spot rates and before the announcement of its expansion into gas trading, was between 4.4 and 5.8 NOK.
However, this expansion is due to begin by the end of the year, at which point the situation should become clearer. For now, it is no surprise that the share price has been trading sideways since the spring.
The last company to post gains was Shell (NYSE: SHEL), which, like Chevron and BP, rebounded from its previous decline with a 0.8 per cent rise.
The biggest fall was seen in New Fortress Energy (NASDAQ: NFE), which lost 17.59 per cent. It remained within its current sideways range, though it dipped below the lower boundary during the week; the decline was mitigated for the rest of the week.
COSCO Shipping Energy Transportation (SS: 600026) fell by 4.44 per cent. The decline continues into its fifth week with a single correction; given the previous pattern of lower highs and deepening, yet still higher, lows, the trend remains ambiguous.
MISC (KLSE: 3816) fell by 3.6 per cent and is close to one of the support levels within its sideways range.
FLEX LNG (NYSE: FLNG) has moved closer to its long-term support level with a 2.2% fall, although it is already within the sideways range (and thus also higher trading volume) from 2024–2025. In terms of volume, this area has seen the highest levels since 2022.
Nakilat (QSE: QGTS) corrected after three weeks of growth and a return to the spring–summer sideways range, falling by 2.4 per cent.
ADNOC Logistics & Services (ADX: ADNOCLS) fell by a symbolic 0.74 per cent, although the decline was steeper during the week. However, the chart shows that support has been held.
Capital Clean Energy Carriers (NASDAQ: CCEC) continues to move sideways, this time near the lower end of the range. Its weekly performance was -0.5 per cent.
Golar LNG (NASDAQ: GLNG; -0.12 per cent) is also continuing its decline towards support, and the fall is on the verge of a correction. Should it continue, the path to the $37 level will be open.
Crystal Ball
Qatar remains on the sidelines among the losers of this conflict. Yet, its actions over the past few weeks have boosted market
optimism, despite PKN Orlen becoming the first buyer to cancel its oil-indexed long-term contract amid the supply disruptions. Its efforts to honour its commitments and fulfil its orders are undoubtedly a significant boost to its customers. US producers are seeking to capitalise on the resulting vacuum by accelerating capacity expansion as supplier diversification takes place. Price is no longer the sole criterion, and even Bangladesh has announced that it has signed a long-term contract with a US producer.
Whilst the coming winter months will bring increased uncertainty and a scramble for gas – partly due to the uncertain geopolitical situation, with a significant risk of further US strikes on Iran – we expect the situation to stabilise and adapt in the spring, primarily through the diversification of suppliers.
About UPI
Established in 2020, the UP World LNG Shipping Index is a rules-based family of stock indices designed to measure the performance of publicly traded companies worldwide engaged in the maritime transportation of liquefied natural gas (LNG). This unique index comprises 21 companies and partnerships worldwide, representing more than 65% of the global LNG carrier fleet in 2020. The UP Index provides premium services, offering freemium and trial access to charts. With the Freemium plan, users can access the basic UP Index vs S&P 500 chart after completing email registration. The trial includes full access for fourteen days.
Final Note
This report primarily relies on technical analysis using weekly data. The summary section is AI-generated.
Disclosure: The author holds beneficial long positions in the shares of ALNG, EE, FLNG, and NFE, whether through share ownership, options, or other derivatives. This report was prepared in-house and reflects our own opinions. We have received no compensation for it and have no business relationship with any company whose shares are mentioned herein.
Disclaimer: This report is provided for informational purposes only and does not constitute investment advice, nor a recommendation or solicitation to buy or sell any securities. It relies primarily on technical analysis using weekly data. Readers should conduct their own research and consult a qualified financial adviser before making any investment decisions.