
Summary
The UP World LNG Shipping Index halted its slide and gained 7.92 points (3.58%) to close at 229.39, back within striking distance of the 230 mark, while the S&P 500 lost 0.57%. The rebound was broad: breadth was 13:7, the median rose 0.99%, and the weighted index (wUPI) added 1.8%, all on still-low volume. New Fortress Energy led with a 41% surge after agreeing a five-year lease of ten mobile turbines (up to 300 MW) to a US investment-grade company, followed by Excelerate (+9%) and Nakilat (+7.6%) off support, and a 7% gain in CCEC. All three Japanese majors rose around 6% — MOL +6.45%, NYK +5.88%, “K” Line +5.83% — breaking above closing-price resistance, with MOL already in a fresh uptrend. The only meaningful decline was Pan Ocean (−6%), pulling back into its high-level range, with Dynagas and BP each off 1.8%. In the background, Asian spot LNG rose for a fourth straight week to a multi-year high of $32.50/MMBtu on Middle East tensions and winter demand, European benchmarks firmed near $32, and spot tanker rates jumped — Pacific to $44,500, Atlantic to $28,000. The updated Crystal Ball turns more constructive: Qatar’s moves to honour its commitments have lifted market sentiment, and supplier diversification (now including a US deal for Bangladesh) is reshaping the market beyond price alone.
UPI & SPX
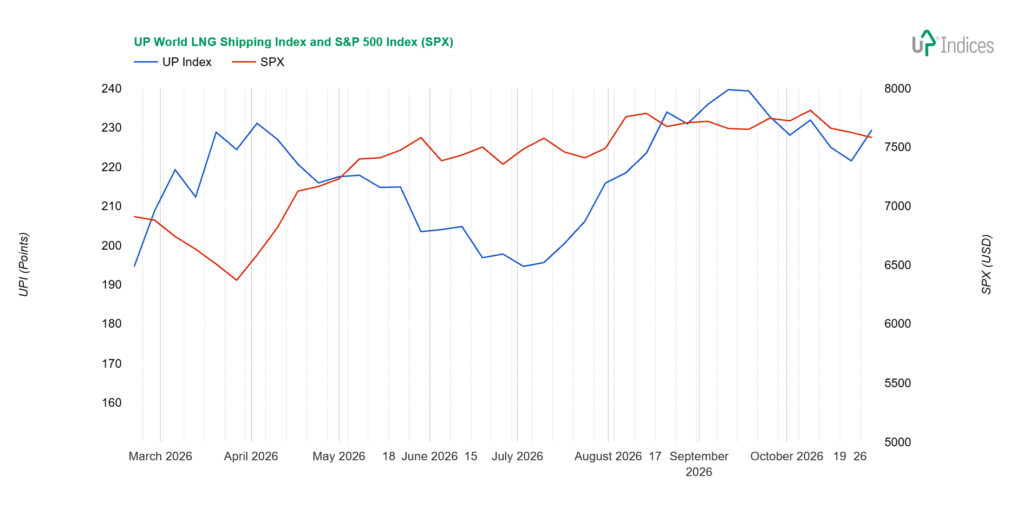
The UP World LNG Shipping Index, which tracks 21 listed LNG shipping companies, gained 7.92 points (3.58%) to close at 229.39 points, while the S&P 500 index lost 0.57%. The chart below illustrates the performance of both indices with weekly data.
Broader View
The UPI halted its decline and rose to within striking distance of the 230-point mark. Trading volume remained low, with the ratio of rising to falling index components standing at 13:7, and the median price change at 0.99 per cent. The weighted index (wUPI) gained 1.8 per cent.
Venture Global has commenced commercial operations at the Plaquemines terminal.
Reuters LNG weekly summary said Asian spot LNG prices rose for a fourth consecutive week to a new multi-year high amid persistent geopolitical tensions in the Middle East, whilst Asian buying interest and expectations of stronger winter demand provided further support.
The average price for December delivery to north-east Asia was estimated at $32.50 per million British thermal units (mmBtu) in the week ending 30 October, the highest since mid-December 2022 and up from $30.50/mmBtu the previous week.
In addition to attacks by Yemen’s Iran-aligned Houthis on Saudi energy and transport infrastructure, which heightened supply uncertainty, prices were also supported by buying interest from importers in Vietnam and India via spot tenders.
In Europe, S&P Global Energy assessed its daily Northwest Europe LNG price benchmark for cargoes delivered in November on an ex-ship basis at $31.910/mmBtu on Thursday, a discount of $0.50/mmBtu to the price at the Dutch TTF gas hub, as colder weather, historically low gas storage levels and geopolitical uncertainty reinforced concerns over winter supply.
Spot rates for LNG tankers rose, particularly in the Pacific, where they climbed to $44,500 per day, whilst in the Atlantic they rose to $28,000 per day, according to Spark Commodities.
Constituents
New Fortress Energy (NASDAQ: NFE) has confirmed its high volatility, rising 41 per cent last week after reports that it agreed to lease 10 mobile turbines capable of generating up to 300 MW of power to an unnamed “US-based investment-grade company”.
The lease has an initial term of five years, with turbine deliveries scheduled between the fourth quarter of 2026 and the first quarter of 2027; the deal is expected to boost the company’s revenue, but the financial terms have not been disclosed.
Excelerate Energy (NYSE: EE) capitalised on support to rise more than 9 per cent, pushing the price toward resistance, which also marks the threshold for a higher level.
Nakilat (QSE: QGTS) moved into third place thanks to positive news, rising by 7.6 per cent. The rise was even higher than during the week, but it failed to sustain that level. This is mainly due to uncertainty over flows through the Strait of Hormuz; however, ‘coincidentally’, it also failed to break through the resistance level around the four-riyal mark. Technically and geopolitically, the rise is positive, but it is not yet enough to change investors’ outlook.
Capital Clean Energy Carriers (NASDAQ: CCEC) posted the second 7 per cent rise of last week, having also capitalised on a rebound from support. Resistance lies at around $24; until then, the trend remains sideways.
All three Japanese stocks rose by around six per cent. Mitsui O.S.K. Lines (TSE: 9104) gained 6.45 per cent, NYK Line (TSE: 9101) rose by 5.88 per cent and “K” Line (TSE: 9107) climbed by 5.83 per cent. The percentage gains are therefore very similar, but the chart patterns are both similar and different. All three broke through their closing price resistance levels and closed above them, though they remain within a zone of strong resistance. The difference is that MOL is the only one already trending upward and no longer trading within a sideways range. If this momentum holds, the other two are likely to follow suit and break out of the sideways range.
The most significant recent rise was recorded by COSCO Shipping Energy Transportation (SS: 600026), at 3.2 per cent. This is a case of ‘up but not really up’. The price ended the week before last at the magnetic support level of the lowest prices, and last week it attempted a more significant rise above the closing price support level. It did not succeed; the price was pushed back down, and the rise therefore only reached those closing prices. This may or may not be positive.
Something similar can be said of Golar LNG (NASDAQ: GLNG), which is also trading near its support level and rose by 1.4 per cent. Here, too, the rally was pushed back.
Chevron (NYSE: CVX) gained nearly one per cent, driven by positive economic outlooks. The price reached a new high.
Tsakos Energy Navigation (NYSE: TEN) is trading at a key resistance level near its all-time high. Although the price fell, it rose by 0.7 per cent week-on-week. This was due to a move at the key resistance level, where the gap opening also marked a high and the price returned to its previous closing price.
Two other companies remain, both showing identical growth of 0.47 per cent. These are Shell (NYSE: SHEL) and Korea Line Corporation (KRX: 005880). Shell, as Chevron mentioned above, continues to rise. KLC fended off a decline attempt and held steady at the previous closing price. It thus continues to move sideways.
The largest – and, in fact, the only significant – decline was that of Pan Ocean (KRX: 028670), which, with a six per cent fall, retreated from an attempt to continue its rise back into a sideways range. At the same time, this range is at its highest price levels.
The second-largest falls did not even reach two per cent. Both Dynagas LNG Partners (NYSE: DLNG) and BP (NYSE: BP) fell by 1.8 per cent. Whilst BP is in a similar pattern to Shell and Chevron, DLNG is testing this year’s lowest prices. However, it remains within the magnetic support range, albeit only just.
ADNOC Logistics & Services (ADX: ADNOCLS) halted its decline by returning to the upper edge of the previous sideways range, which formed at the end of July.
FLEX LNG (NYSE: FLNG) has been trading at support for the third week running. While it rebounded from a fall below this level the week before last, last week saw a rejection of any upward movement. The result was a weekly decline of 0.7 per cent.
MISC (KLSE: 3816) continued to trade within the spring-time sideways range, to which it had returned the week before last. The week saw both gains and losses, resulting in a flat performance of -0.6 per cent.
ALNG (OSE: ALNG) traded at the upper edge of its sideways range. Here too, a larger decline was rejected, resulting in a move of -0.3 per cent.
Exmar (EBR: EXM) closed at the same price as it opened, with the mid-week decline being rejected.
Crystal Ball
Qatar remains on the sidelines among the losers of this conflict, yet its actions over the past few days have boosted market optimism. Its efforts to honour its commitments and fulfil its orders are undoubtedly a significant boost to its customers. US producers are seeking to capitalise on the resulting vacuum by accelerating capacity expansion as supplier diversification takes place. Price is no longer the sole criterion, and even Bangladesh has announced that it has signed a long-term contract with a US producer.
Whilst the coming winter months will bring increased uncertainty and a scramble for gas – partly due to the uncertain geopolitical situation, with a significant risk of further US strikes on Iran – we expect the situation to stabilise and adapt in the spring, primarily through the diversification of suppliers.
About UPI
Established in 2020, the UP World LNG Shipping Index is a rules-based family of stock indices designed to measure the performance of publicly traded companies worldwide engaged in the maritime transportation of liquefied natural gas (LNG). This unique index comprises 21 companies and partnerships worldwide, representing more than 65% of the global LNG carrier fleet in 2020. The UP Index provides premium services, offering freemium and trial access to charts. With the Freemium plan, users can access the basic UP Index vs S&P 500 chart after completing email registration. The trial includes full access for fourteen days.
Final Note
This report primarily relies on technical analysis using weekly data. The summary section is AI-generated.
Disclosure: The author holds beneficial long positions in the shares of ALNG, EXM, FLNG, and NFE, whether through share ownership, options, or other derivatives. This report was prepared in-house and reflects our own opinions. We have received no compensation for it and have no business relationship with any company whose shares are mentioned herein.
Disclaimer: This report is provided for informational purposes only and does not constitute investment advice, nor a recommendation or solicitation to buy or sell any securities. It relies primarily on technical analysis using weekly data. Readers should conduct their own research and consult a qualified financial adviser before making any investment decisions.