
Listen audio summary on Spotify
Summary
The UP World LNG Shipping Index fell 6.97 points (3.0%) to close at 224.91, pulled down by a broad equity-market selloff — the S&P 500 lost 1.95%, its biggest weekly drop since June. But the sector’s internals were far stronger than the headline: the median constituent fell just 0.43%, and the weighted index (wUPI) actually rose 2.87%, so the decline was concentrated in a few heavier names rather than reflecting genuine sector weakness. Breadth was 10:11 on above-average volume. Two Asian names led with double-digit gains — MISC +15.4% (fleet expansion with QatarEnergy and a 20-year Petronas newbuild order) and Pan Ocean +11% (breaking through all key resistance) — while the oil & gas majors surged to fresh highs: BP +8.6%, Shell +6.5% and Chevron +6.14%. The drag came from COSCO, down almost 15%, with FLEX LNG and Dynagas each off 8% and Golar −5.6%. In the background, gas markets stayed volatile and bullish: Asian prices reached $29.30/MMBtu, and European prices hit their highest since December 2022 on Hormuz tanker attacks and strong cross-basin competition, with Morgan Stanley lifting its winter TTF forecast to €90/MWh. Spot tanker rates held at $20,500 (Atlantic) and eased to $27,000 (Pacific).
UPI & SPX
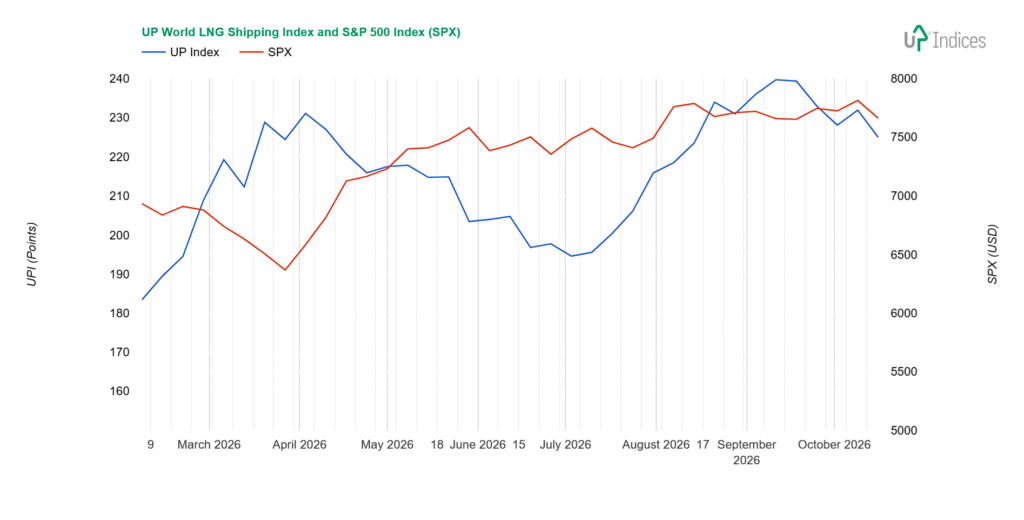
The UP World LNG Shipping Index, which tracks 21 listed LNG shipping companies, lost 6.97 points (3.0%) to close at 224.91 points, while the S&P 500 index lost 1.95%. The chart below illustrates the performance of both indices with weekly data.
Broader View
Negative sentiment in equity markets affected the UPI, as shown by the UPI and S&P 500 charts. The median change in the UPI was -0.43 per cent, whilst the weighted index (wUPI) rose by 2.87 per cent. Taken together, these figures do not indicate particularly negative sentiment. The ratio of rising to falling index components was 10:11. Trading volume was above average, with above-average levels seen among both rising and falling stocks.
The gas market remains volatile, fuelled by rising European purchases. The Reuters weekly summary, on which the rest of this section is based, states that Asian gas prices rose due to both repeated Iranian attacks on ships passing through the Strait of Hormuz and increasing European demand. The average Asian price reached $29.30/mmBtu.
Despite an increase in transits via the Strait of Hormuz since September, as well as loadings at Qatar’s Ras Laffan facility, continued attacks on tankers and uncertainty over safe passage are keeping prices supported, he said.
“With the disruption likely to persist into winter, competition for flexible LNG supply remains an important bullish factor,” said Arturo Regalado, senior LNG analyst at Kpler.
Some tankers continue to leave the Gulf, but the situation remains volatile, said Alex Froley, senior LNG analyst at data intelligence firm ICIS.
“The competition between Europe and Asia for flexible cargoes remains strong, as evidenced by increased mid-Atlantic course-change activity,” he added.
The LNG tanker Shra’ouh, which was heading round Africa towards India, changed course back north, signalling a destination in the UK, but has recently turned south again, likely bound for Asia, Froley said.
Martin Senior, head of LNG pricing at Argus, said Asian demand has been supported, with Chinese and South Korean buyers entering the market for spot cargoes, boosting competition between basins and driving European gas prices higher.
In Europe, gas prices hovered around €88.57 per megawatt hour (MWh), or $29.20/mmBtu, on Friday afternoon, their highest intraday level since December 2022.
“Even with recent warm weather and a recovery in Gulf LNG flows to 30 per cent of pre-conflict levels, our European region will still enter winter with storage at a record low of 74 per cent,” said Morgan Stanley analysts in a report.
Morgan Stanley raised its winter TTF forecast to €90/MWh this week and said it could reach €135/MWh due to a combination of a prolonged outage in Qatar, colder weather or other LNG disruptions.
S&P Global Energy assessed its daily Northwest Europe LNG price benchmark for cargoes delivered in November on an ex-ship basis at $27.825/mmBtu on Thursday, a $0.580/mmBtu discount to the front-month price at the Dutch TTF gas hub.
Spot rates for LNG tankers remained at $20,500 per day for the Atlantic, whilst for the Pacific they fell to $27,000 per day, according to Spark Commodities.
Constituents
There were also two instances of double-digit growth, both in Asia. The larger of the two was recorded by Malaysia’s MISC (KLSE: 3816), which expanded its LNG fleet with a new tanker in October (under a contract with QatarEnergy) and has this year placed an order with Chinese shipyards for five new vessels under a 20-year contract with Petronas. Delivery is expected in 2030.
According to TA, the strong 15.4 per cent rise in its share price took it out of a sideways range to its spring highs, closing just below its highest closing price without forming a wick at higher prices. Trading volume was slightly above average.
The second company to post double-digit growth was South Korea’s Pan Ocean (KRX: 028670), which gained 11 per cent. During the week, however, its growth (in the short term) reached as high as 30 per cent. In any case, it has broken through all resistance levels, including key levels, and is continuing towards its pre-pandemic ranges.
The next three major gains, of 8 per cent and 6 per cent, share a common thread, as they all relate to the oil and gas trio: BP (NYSE: BP; +8.6 per cent) easily broke through resistance (incidentally, the same level as in 2018), with the closing price and the high for the day being almost identical. Trading volume was slightly above average. Chevron (NYSE: CVX; +6.14 per cent) performed similarly, reaching new all-time highs. Shell (NYSE: SHEL) broke through resistance as early as the beginning of September and has now recorded a clear gain of 6.5 per cent. In its case, too, these are all-time highs.
ALNG (OSE: ALNG) gained 1.5 per cent but continues to trade sideways. Given the company’s transformation from a pure transport operator (two TFDE LNG tankers on the spot market) to a gas trader with transport capacity, we expect a change in trend only once this transformation is complete.
Exmar (EBR: EXM; +2.2 per cent) is undergoing a similarly subtle transformation, expanding its operations across the entire value chain from upstream to downstream. The share price is trading sideways.
Other movements were less than 0.8 per cent. Korea Line Corporation (KRX: 005880) made an unsuccessful attempt to break out of its sideways range. Mitsui O.S.K. Lines (TSE: 9104) fared slightly better; while its attempt to break above the key resistance level was also unsuccessful, it closed above the range’s closing-price resistance level. “K” Line (TSE: 9107), on the other hand, closed within the range. All three Japanese companies – we’ll come back to NYK Line later – are trading within a sideways range at the highest price levels.
This brings us to the falling companies. COSCO Shipping Energy Transportation (SS: 600026) suffered the heaviest losses, falling by almost 15 per cent. The chart remains unclear for now. The current uptrend was halted – and perhaps ended – after reaching spring levels. In any case, the price is now below spring levels. It was also the only double-digit decline.
Flex LNG (NYSE: FLNG) and Dynagas LNG Partners (NYSE: DLNG) fell by 8 per cent. FLNG closed below the support level of its sideways range for the first time this year, suggesting a breakout. It reached the upper boundary of the previous sideways range’s high prices, but is also near the magnetic support level of the higher range. Given its high cash reserves, dividend payments are not at risk in the foreseeable future, so there is currently no reason for a sustained decline – apart from the general fall in share prices. DLNG fell to its lowest price level since 2024; trading volume was above average for both stocks.
Golar LNG (NASDAQ: GLNG; -5.6 per cent) also fell below its support level. This time, on higher volume, it also breached the magnetic support level.
Excelerate Energy (NYSE: EE) and New Fortress Energy (NASDAQ: NFE) both fell by four per cent. EE bounced off its support level after the decline, then rose slightly. The current trend is therefore sideways. NFE also showed a corrective decline, yet it has reached new lows.
Nakilat (QSE: QGTS) closed near the previous week’s close, supported by a higher open. The company, affected by geopolitical tensions, thus lost only 1.8 per cent.
This brings us to NYK Line (TSE: 9101), which fell 1.3% while trading in the upper range of its sideways channel on below-average volume.
Capital Clean Energy Carriers (NASDAQ: CCEC) fell 1%, trading near the support level of its two-year sideways range.
ADNOC Logistics & Services (ADX: ADNOCLS) remains at its major resistance level, down 0.9% after the rise the week before last.
Tsakos Energy Navigation (NYSE: TEN) also fell 0.4 per cent after failing to break above resistance at its all-time high. It therefore remains within a short-term sideways range. The failed breakout appears linked more to the stock market decline than to a waning appetite for the company, given the above-average daily volume during the upward breakout. However, the following days saw the aforementioned return to the range.
Crystal Ball
Qatar remains sidelined among the conflict’s losers — but the key constraint is export, not production. The damage to Ras Laffan removed around 17% of capacity (two of 14 trains), which QatarEnergy expects to take three to five years to repair. The remaining ~80% of capacity is intact and could, in principle, return to market — but the Strait of Hormuz is Qatar’s sole export route, and executives (including Shell’s) caution that even a reopening would not restore pre-war flows overnight, as high war-risk insurance continues to deter tanker returns to the Gulf. For now, this keeps a large share of Qatari volume bottled up, and US LNG exporters emerge as the clear winners. European importers were shielded from spot price increases largely because of long-term US contracts; however, these are not enough to replenish winter inventories, and European companies must return to the market despite Qatar’s continuing export restrictions. We expect most of the rising US gas production to flow toward Europe. New global LNG producers should also benefit, as energy source diversification becomes more important than ever — provided importing economies remain healthy enough to absorb higher energy costs. The outlook remains volatile, but positive in the long term. The gradual phasing out of steam vessels and the addition of new liquefaction capacity will continue to drive the sector forward.
About UPI
Established in 2020, the UP World LNG Shipping Index is a rules-based family of stock indices designed to measure the performance of publicly traded companies worldwide engaged in the maritime transportation of liquefied natural gas (LNG). This unique index comprises 21 companies and partnerships worldwide, representing more than 65% of the global LNG carrier fleet in 2020. The UP Index provides premium services, offering freemium and trial access to charts. With the Freemium plan, users can access the basic UP Index vs S&P 500 chart after completing email registration. The trial includes full access for fourteen days.
Final Note
This report primarily relies on technical analysis using weekly data. The summary section is AI-generated.
Disclosure: The author holds beneficial long positions in the shares of ALNG, FLNG, and NFE, whether through share ownership, options, or other derivatives. This report was prepared in-house and reflects our own opinions. We have received no compensation for it and have no business relationship with any company whose shares are mentioned herein.
Disclaimer: This report is provided for informational purposes only and does not constitute investment advice, nor a recommendation or solicitation to buy or sell any securities. It relies primarily on technical analysis using weekly data. Readers should conduct their own research and consult a qualified financial adviser before making any investment decisions.