
Summary
The UP World LNG Shipping Index lost 3.14 points (1.59%) last week, closing at 194.60 points, while the S&P 500 gained 1.76% in a holiday-shortened week. The UPI continues to weaken following a slowdown in its decline, though the weighted index lost only a quarter of a per cent. The ratio of advancing to declining stocks was even at 10:10, and volume was slightly below average. The UPI remains above its 50-week moving average at 190 points, leaving room for a safe decline toward this long-term support. The first Qatari LNG tanker sailed through the Strait of Hormuz with its AIS activated amid easing tensions. At the same time, Qatar extended its force majeure until mid-August, with liquefaction units expected to resume in early September. ALNG led the gainers with +8.76%, while COSCO Shipping Energy Transportation fell nearly 13% — the only significant decline of the week.
UPI & SPX
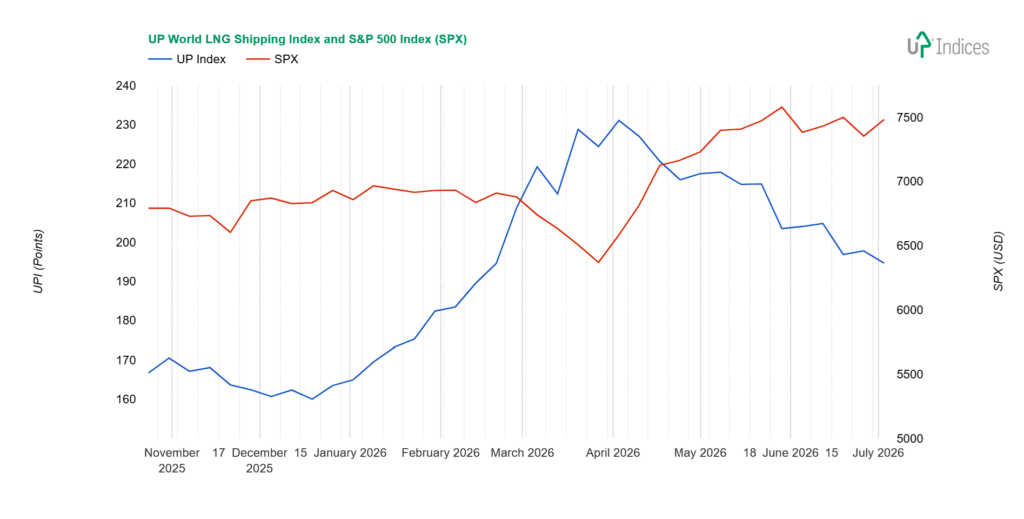
The UP World LNG Shipping Index, which tracks 20 listed LNG shipping companies, lost 3.14 points (-1.59%), closing at 194.6 points, while the S&P 500 index gained 1.76%. The chart below illustrates the performance of both indices with weekly data.
Broader View
The UPI continues to weaken following a slowdown in its decline, though the weighted average lost only a quarter of a per cent. Volume was slightly below average, and the ratio of advancing to declining stocks was even, at 10:10.
The UPI 50 long-term moving average (equivalent to 200 days) remains below the UPI at 190 points. The UPI therefore still has room to fall toward this long-term support level.
LNG prices continue to be influenced by geopolitics and weather. While the first Qatari LNG tanker sailed through the Strait of Hormuz with its AIS activated amid easing tensions, warm weather in Asia and Europe is pushing prices higher. According to a weekly Reuters summary, Qatar has extended the force majeure suspension of shipments until mid-August, but liquefaction units are expected to resume operations in early September. However, it will take significantly more time to repair the damaged facilities at Ras Laffan.
Spot rates for LNG tankers remain at $90,000 per day for the Atlantic and $70,000 per day for the Pacific.
Constituents
The Chinese company COSCO Shipping Energy Transportation (SS: 600026) saw the largest loss, dropping nearly 13 per cent. It repeated a decline seen a month ago, but this time it led to the formation of a support level. This is also evidenced by increased trading volume, which pushed the price back up to that level, thereby mitigating the weekly decline.
However, the next-largest decline didn’t even reach 1.8%! COSCO was thus the only stock to see a more significant downward move. MISC (KLSE: 3816) lost 1.77%, Golar LNG (NASDAQ: GLNG) fell by 1.51%, NAKILAT (QSE: QGTS) fell by 1.26%, and Chevron (NYSE: CVX) and NYK Line (TSE: 9101) rounded out the percentage losses with declines of 1.09% and 1.03%, respectively.
MISC returned to last year’s price range, moderating its weekly decline and bringing the closing and opening prices closer together. Golar continues its slight downward trend within a sideways range, though downward price pressure appears to persist. NAKILAT, having returned to its pre-war price range, remains at its lower boundary, with attempts to test lower prices having been rejected. The market is now waiting to see how the situation will develop and when production will actually resume. Chevron continues its gradual decline, but here, too, prices below the week’s closing levels were rejected. NYK Line found support in the upper half of its two-year sideways range and has so far held it.
Further losses were no greater than one per cent. Mitsui O.S.K. Lines (TSE: 9104) and FLEX LNG (NY-SE: FLNG) each fell by half a per cent. Both avoided more significant declines during the week and closed very close to their opening prices. MOL, like NYK Line, is holding in the upper part of its two-year range, and FLEX remained within its current range.
Rounding out the group is ADNOC Logistics & Services (ADX: ADNOCLS), which, conversely, attempted to rise but ultimately remained near the upper end of its price range, losing 0.17%.
Among the rising stocks, the most successful was ALNG (OSE: ALNG), formerly Awilco LNG, which rose by 8.76%. This marked the first significant gain in some time and was accompanied by increased trading volume, bringing the price back into this year’s sideways range.
New Fortress Energy (NASDAQ: NFE) improved its share price by 7.17%, but it is still trading at historic lows.
Dynagas LNG Partners (NYSE: DLNG) followed with a 6% gain, offsetting its previous decline and returning—temporarily?—to the 2025 price range. Why temporarily? Trading volume was very low.
Capital Clean Energy Carriers (NASDAQ: CCEC) rose 4.3%, but it continues to trade within a relatively wide sideways range.
Two Asian companies posted gains of 3%: Korea Line Corporation (KRX: 005880) and “K” Line (TSE: 9107). The former rose 3.74% and the latter 3.44%. KLC rose, like other Asian companies, after returning to the sideways range from 2024–2025. “K” Line continues to move sideways within this year’s range near its peak prices.
Shell (NYSE: SHEL) and Tsakos Energy Navigation (NYSE: TEN) posted gains of just under 2%. While Shell has maintained its price above the 2024–2025 range following previous declines, Tsakos, like some others, continues to trade within the range near its peak prices.
The charts also look interesting for two companies that seem to have posted only small gains. Excelerate Energy (NYSE: EE) and BP (NYSE: BP) posted gains of “only” 0.8% and 0.7%, respectively, but for EE, this means it has maintained its breakout from the sideways range, and thus has a chance for further significant growth, while BP has halted its several-week decline.
Crystal Ball
Qatar has been temporarily sidelined among the conflict’s losers due to industrial damage to its facilities, whilst US LNG exporters—and European importers—emerge as the clear winners. However, the vulnerable Panama Canal and ongoing US-Chinese tensions warrant attention. We expect most of the rising US gas production will flow towards Europe. New global LNG producers should also benefit from this conflict, as energy source diversification becomes more important than ever—provided importing economies remain healthy enough to absorb higher energy costs.
The outlook remains volatile, but positive in the long term. Companies with spot tankers are benefiting from high rates and longer distances. The gradual phasing out of steamers and the addition of new liquefaction capacity will continue to drive the sector forward.
About UPI
Established in 2020, the UP World LNG Shipping Index is a rules-based family of stock indices designed to measure the performance of publicly traded companies worldwide engaged in the maritime transportation of liquefied natural gas (LNG). This unique index comprises 20 companies and partnerships worldwide, representing more than 65% of the global LNG carrier fleet in 2020. The UP Index provides premium services, offering freemium and trial access to charts. With the Freemium plan, users can access the basic UPI vs S&P 500 chart after completing email registration. The trial includes full access for fourteen days.
Final Note
This report primarily relies on technical analysis using weekly data. The summary section is AI-generated.