Summary
Most companies in the UP World LNG Shipping Index (UPI) fluctuated within a stable range, reflecting resistance and support levels, as market conditions showed little momentum in either direction. With cold weather in Europe, falling spot rates, and tankers shifting routes from Asia, the UP World LNG Shipping Index continued its third week of sideways movement at 0.4%.
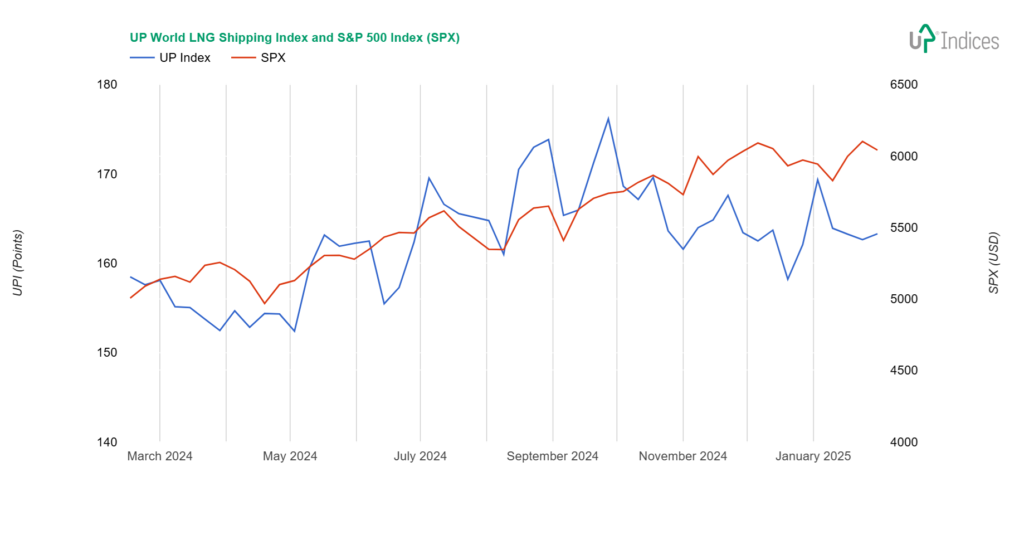
UPI & SPX
Last week, the UP World LNG Shipping Index (UPI), which tracks listed LNG shipping companies, gained 0.65 points, equivalent to 0.40%, closing at 163.28 points. The S&P 500 index lost 1%. The chart below illustrates the performance of both indices with weekly data.
Broader view
Last week continued the previous week’s trends: cold weather in Europe, falling spot rates, and tankers diverting from Asia to Europe.
As Marwa Rashad of Reuters reports, due to the Asian New Year, gas consumption there has fallen, continuing the diversion of LNG tankers towards Europe. In her weekly summary, she quotes Toby Copson of Davenport Energy Partners as saying gas consumption in China is now lower than the seasonal average. In comparison, consumption in Europe is also higher due to bunkering.
Spot rates continue to fall, with Atlantic spot rates down to $3,500 and Pacific spot rates down to $11,500, according to Spark Commodities. Spot rates for steam-powered ships are negative. As Greg Molnar of the International Energy Agency (IEA) correctly noted, these rates are well below the operating costs of the ships, typically $14,000.
Constituents
The UPI is still going sideways and is now in its third week of moving around 0.4% per week. Asian stocks have been rising, and the rest of the world has moved in both directions. Movements were relatively modest, with the most significant changes—both ways—being five per cent. However, movements of one to two per cent prevailed. The growth in UPI thus corresponded to the movement of companies in the sector and was not dragged down by one or two companies.
Capital Clean Energy Carriers (NASDAQ: CCEC) showed the most significant move to the upside, overcoming October’s resistance and gaining 5.3%.
Tsakos Energy Navigation (NYSE: TEN) was a close second with a 3.9% gain, reversing its two-week decline. But the stock has been in a downtrend since May.
Mitsui O.S.K. Lines (TSE: 9104) has shown a 3.5% gain. The long-term sideways influence has been influencing the current direction move since 2024, although since November, the moves have been more in the upper half of that range.
Other growth participants have put in performances starting with one or even zero. Golar LNG (NASDAQ: GLNG) is at the very edge of support, and while it has risen 1.5%, it was just a growth pullback to support. On the other hand, breaking support is strongly negative, so reversing the decline is a small victory. Flex LNG (NYSE/OSE: FLNG) has settled into a range and continues to move up and down above $25.
Next, let’s mention the NYK Line (TSE: 9101), which, while adding only 1.4%, bounced for a second week from its long-term support. Still near support is the “K” Line (TSE: 9107), up 1.1%.
Awilco LNG (OSE: ALNG) saw the most significant decline, down 5.3%. On the positive side, it has stabilised above its most profound decline following the November reaction to the change from a long-term to a spot contract. However, the development in rates does not provide her with much help.
Chevron (NYSE: CVX) lost 4.2% and failed to break the resistance line. Nakilat (QSE: QGTS) and Excelerate Energy (NASDAQ: EE) both fell an identical 3.8%. While Nakilat corrected its prior advance, EE returned to the support boundary.
Dynagas LNG Partners (NYSE: DLNG) is now in its fourth week and, therefore reluctant, back from its rocket ride, rising 16% above the $5.50 level in one week. It was down 2.6% this time, but the starting level still hasn’t been reached.
BP has stabilised above the $31 level, but this new range is still below the summer 2024 range. However, BP has been in a downtrend since May 2024, and this breakout may bring upside.
Crystal Ball
Our short-term outlook stays unchanged and is cautiously optimistic. The decline of spot rates is still marginal for most UPI constituents, and demand for LNG growth is still strong. Our long-term view is still positive, and we expect situationally or management-driven actions and potential new long-term contracts.
About UPI
Established in 2020, the UP World LNG Shipping Index is a rules-based stock index family designed to measure the performance of worldwide publicly traded companies involved in the maritime transport of liquefied natural gas (LNG). This unique index covers 19 companies and partnerships worldwide, representing over 65% of the world’s LNG carrier fleet in 2020. The UP Index offers premium services with freemium and trial access to charts. With Freemium, users can access the basic UPI vs S&P 500 chart after email registration. The trial includes full access for fourteen days.
Source: UP-Indices.com via LNGshippingStocks.com